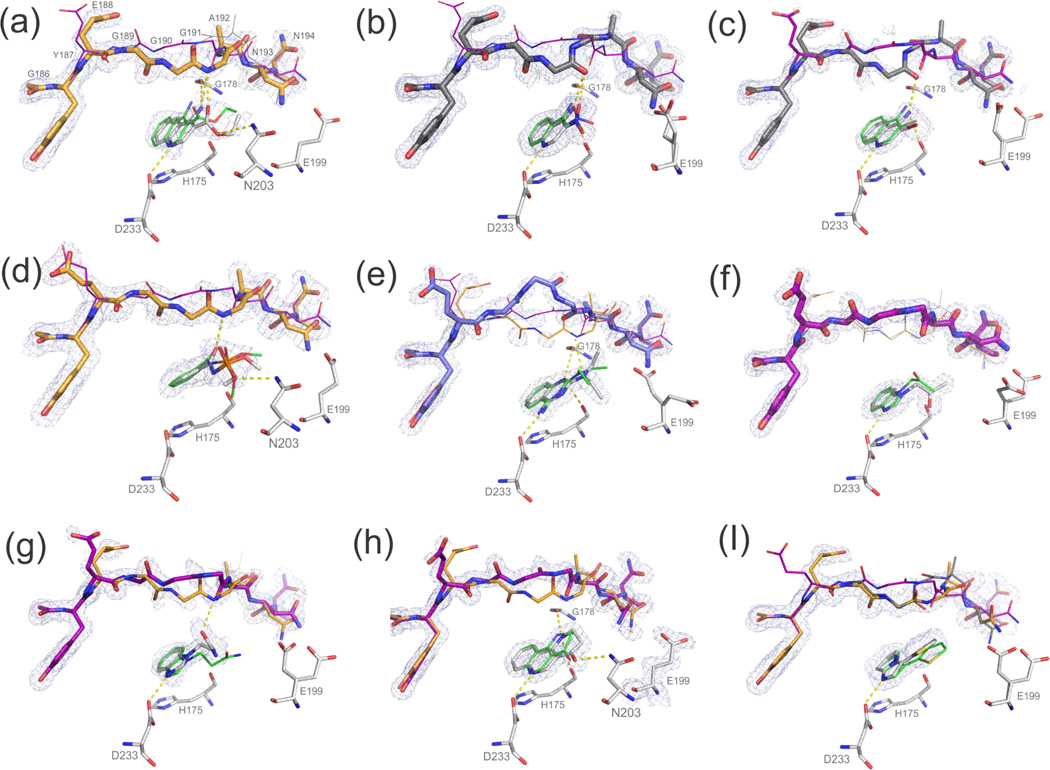
Figure 3. Experimental binding poses vs. prospective docking predictions.
Electron density at 1sigma shown for ligand and loop conformations. Loop stick thickness corresponds to experimentally observed occupancies; coloring as before with loop conformation A in purple, B in grey, C in orange and D (for compound 10) in blue.
Superposition of ligand poses with experimental in grey versus docked in green.
(a) compound 6, (b) 7, (c) 8, (d) 9, (e) 10, (f) 11, (g) 12, (h) 13, (i) 14.
For clarity, co-crystallized MES for compounds 6 (a), 9 (d) and 12 (g) has been omitted.

