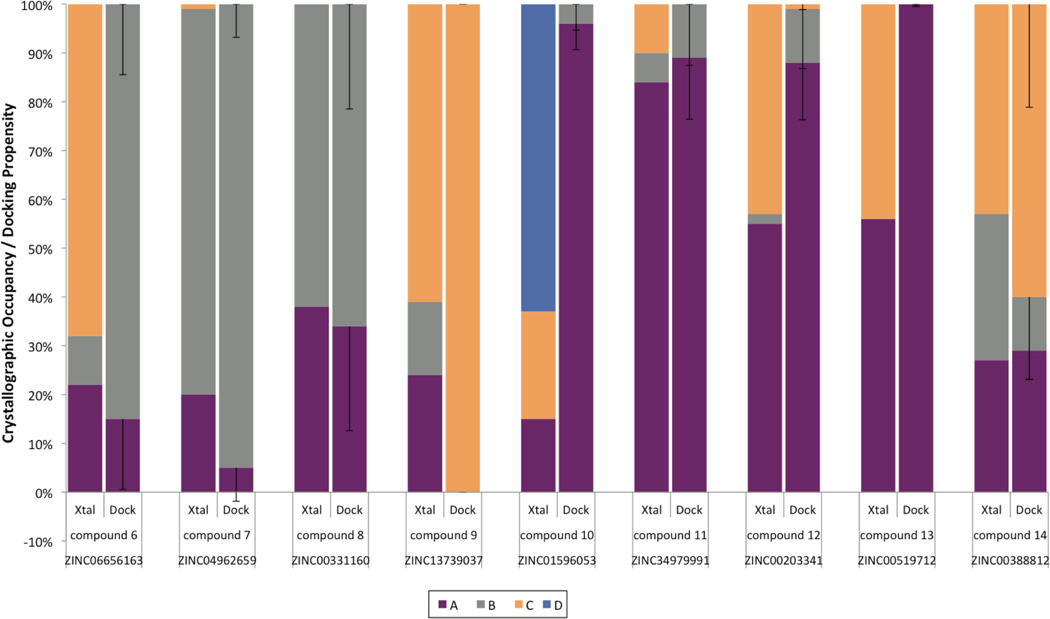
Figure 4. Predicting loop occupancies in bound complexes.
The loop occupancies and predicted propensities for compounds 6–14 are shown, with crystallographic occupancies at left and predicted loop propensities (with m = 2) at right in each pair. Error bars for the loop propensity represent the standard deviation of the occupancies by varying the flexible weighting multiplier m from 1 to 3. The major loop conformation is predicted correctly for all cases but compound 10 that prefers a fourth loop, D, conformation that was not modeled; compounds 6 and 12 have a larger C loop presence due to the partial presence of MES.

