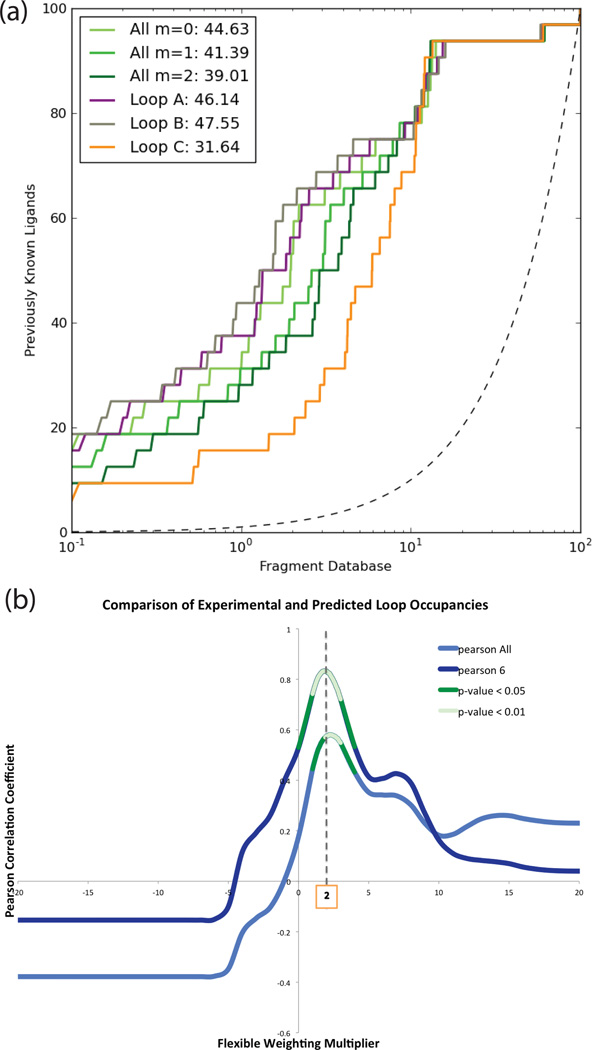
Figure 5. Enrichment alone cannot distinguish first-in-class from best-in-class.
(a) Retrospective enrichment of known ligands against decoys (adjusted logAUC) for loops A, B, and C individually (colored as purple, grey and orange) and combined with different multipliers (tones of green). Adjusted area under the log ROC plot is shown in the legend (cf. Suppl. Table 6 for other common performance metrics).
(b) Pearson correlation of experimental and predicted loop occupancies with statistically significant areas highlighted in green (dark green for p-values < 0.05; light green for p < 0.01). Pearson All is for all 9 compounds, Pearson 6 is the correlation only considering compounds 7, 8, 9, 11, 13 and 14, where results are not distorted by a partial presence of MES.

