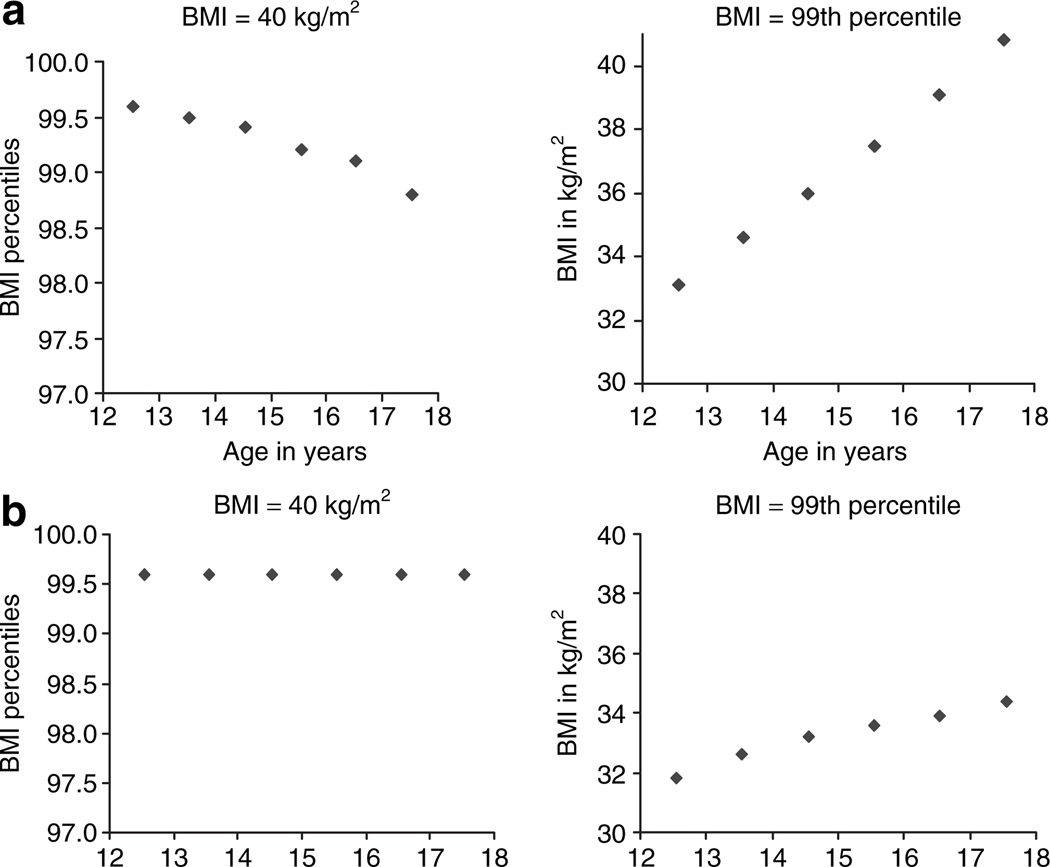
Figure 1.
BMI values in percentile or in kg/m2 for cutoff points of severe obesity. (a) Adolescent girls. (b) Adolescent boys. BMI values or percentiles were calculated based on the age at the midpoint of the age category in years (e.g., value at 12.5 years for an individual in the age category 12 (12–12.9) years old) using National growth chart data from the CDC (26); BMI percentile values that correspond to a BMI = 40 kg/m2 are higher than the BMI = 99th percentile and the BMI values that correspond to the 99th percentile are <40 kg/m2, especially among younger adolescents. Adapted from the National growth charts data (26).

