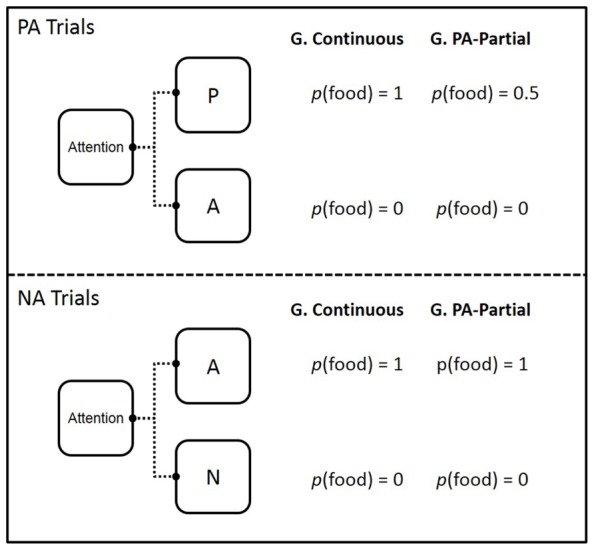
FIGURE 1.

Design of Experiments 1 and 2. The colors (red, green, and blue) associated with stimuli P, A, and N were counterbalanced across subjects. P, A, and N appeared equally often on the left and right keys; G denotes Group and p denotes probability.
