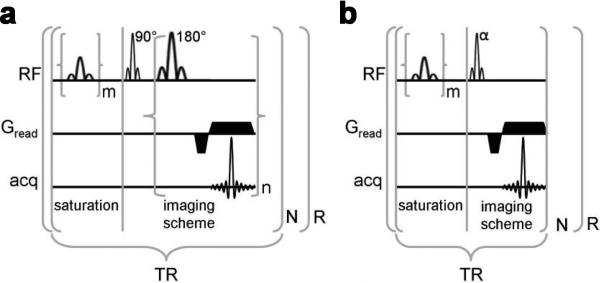
Figure 6.
Two strategies to create CEST contrast when using fast MRI sequences: a) Pulse sequence diagram of a PARACEST detection method with a multiple-echo imaging scheme; b) Pulse sequence diagram of a PARACEST detection method with a short repetitive saturation scheme. For both schemes, m represents the number of selective saturation pulses that comprise 's, and R represents the number of repetitions. For presat-RARE, n represents the number of echos that are acquired per excitation (a.k.a., RARE factor), the product of n and N represents the number of phase encoding steps, and the first lobe of Gread alternates in phase for each successive echo. For presat-FLASH, N represents the number of phase encoding steps. Reproduced from Fig.1 in reference (91) with permission.

