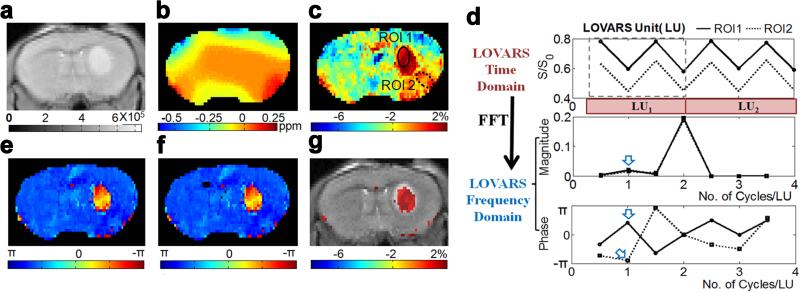
Figure 9.
In vivo demonstration of the LOVARS scheme as applied to the imaging of 9L gliosarcomas in mice. a) T2-w scout image; b) B0 shift map (WASSR); c) uncorrected MTRasym map; d) LOVARS time domain data (top) with phase (middle) and magnitude (bottom) traces determined through FFT with ROIs as marked in c, ROI1: tumor region and ROI2: control tissue with large B0 shift. The arrows point to the average phase (bottom) and magnitude (middle) in ROI1 and ROI2 at 1cycle/LU based on FFT; e) LOVARS phase map calculated using FFT; f) LOVARS phase map calculated using GLM; g) thresholded LOVARS imaginary component map. Reproduced from reference (125) with permission.

