
Figure 3.
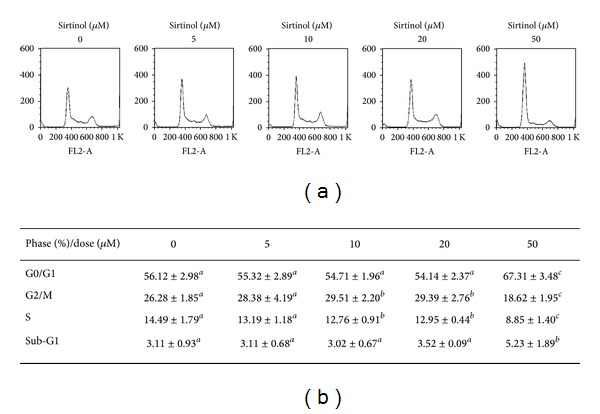
The effect of sirtinol on cell cycle distribution of lung cancer cells. H1299 cells treated with indicated concentrations (from 5 to 50 μM) of sirtinol for 24 h, respectively. Cells were stained with PI and detected the cell cycle distribution by flow cytometry. (a) Flow cytometry profile represents PI staining in x-axis and cell number in y-axis. (b) The quantitative analysis of cell cycle distribution. Different letter notations indicate the statistical significance between drug treatment and vehicle (a versus b and a versus c indicate the P < 0.05 and 0.001, resp.).