
Figure 1.
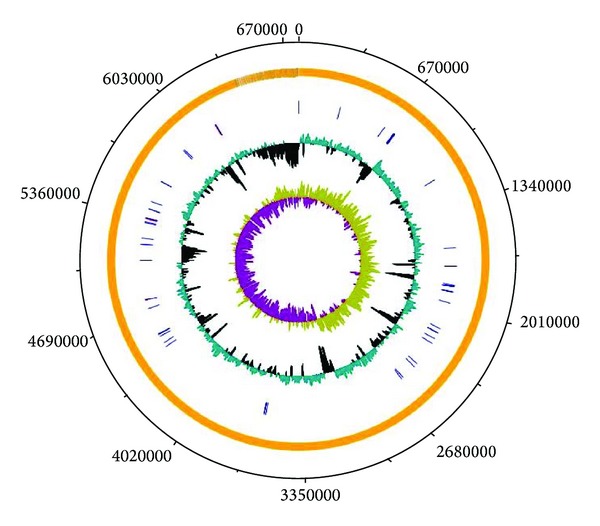
Graphical map of the P. aeruginosa PGPR2 draft genome. From the outside to the inside: open reading frames, rRNA operons, and tRNAs are shown in yellow, red, and blue, respectively. G+C content plot and GC skew (purple: negative values, olive: positive values) are also shown.