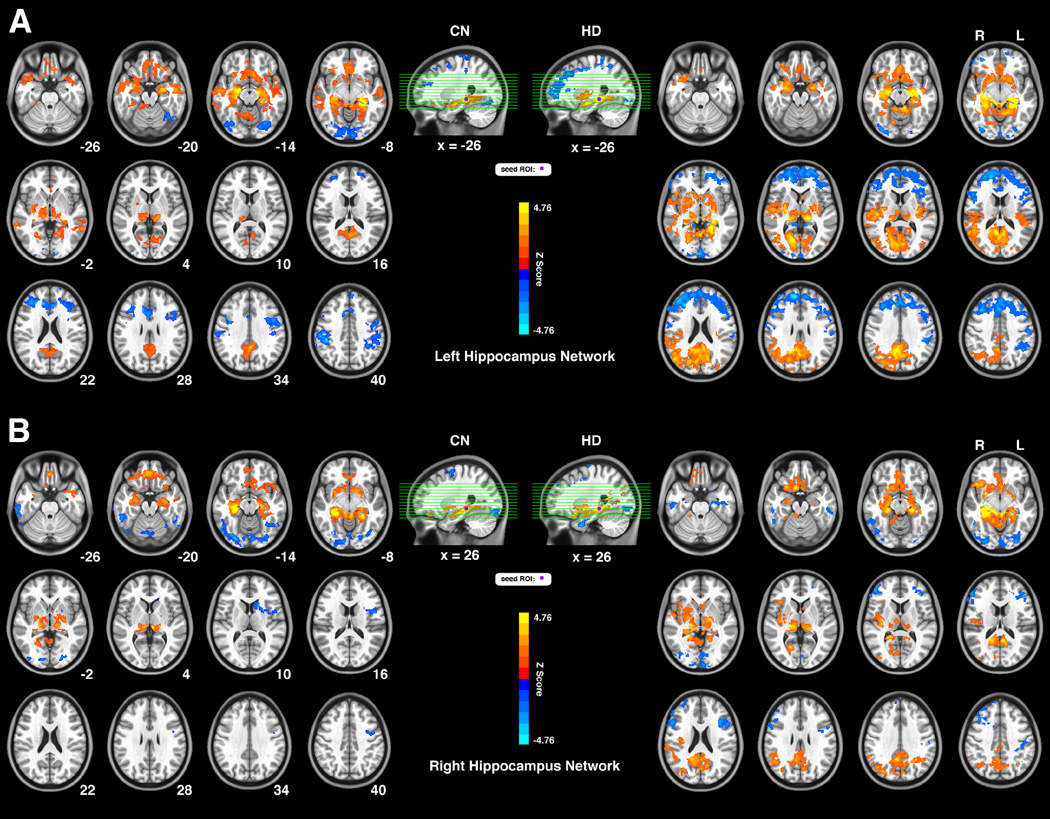
Fig. 1.
Connectivity patterns of the intrinsic hippocampus functional network for two groups both seeded in the left (Fig. 1A) and right (Fig. 1B) hippocampus. The bright color marked brain regions with positive functional connectivity and the blue color show anticorrelated connectivity. The left part of the Fig. 1A and Fig. 1B indicates connectivity patterns for the CN group, and the right part for the HD group. The letters ‘R’ and ‘L’ on top of the axial images show the side of the hemisphere; the numbers below the axial images indicate the slice position at the z-coordinate. This group-level pattern is obtained via a voxel-wise 1-sample t-test and significance level was set at threshold p < 0.05. The results were corrected for multiple comparisons (3dClustSim, AFNI, α=0.05, p<0.05, cluster size > 2630mm3).
Abbreviations: CN, control non-drug users; HD, heroin dependent subjects.

