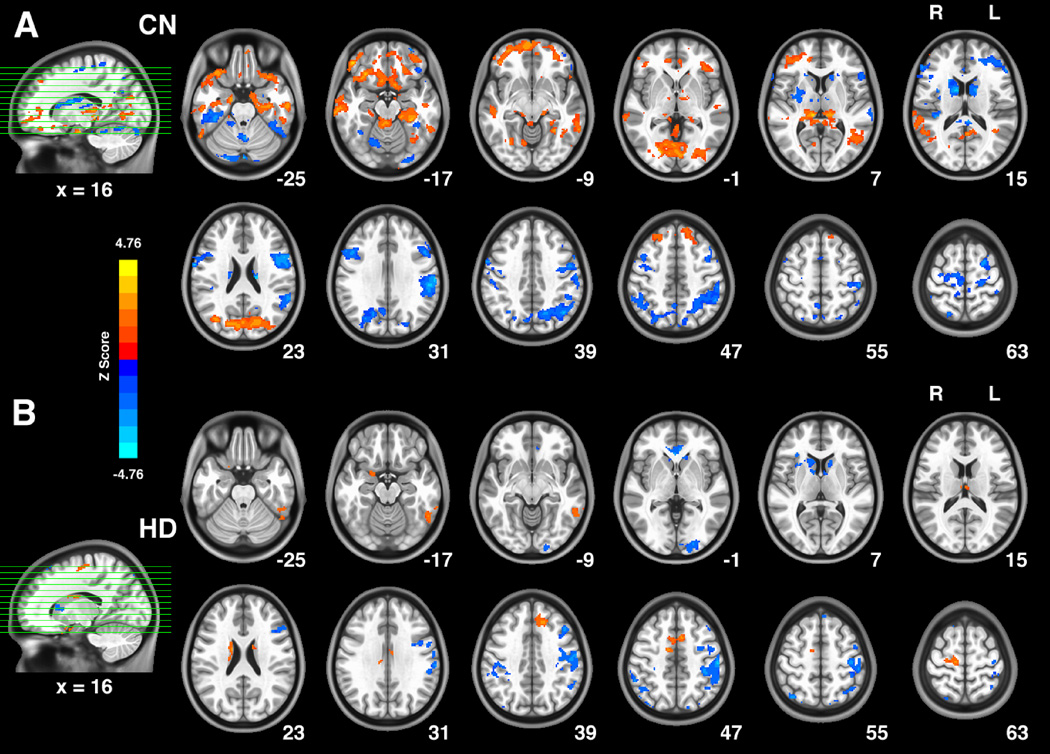
Fig. 3.
The voxel-wise correlation between the intrinsic hippocampus functional network strength (m-value) and the BIS Total score in the HD group (A) and the CN group (B). Bright color in these patterns indicates positive correlation between BIS total score and the connectivity strength, while blue color indicates negative correlation. The age, years of education and gray matter volume of each individual were controlled as covariates of no interests. The significance level of these two distinct behavioral correlation patterns were set at threshold p < 0.05, and the results were corrected for multiple comparisons (3dClustSim, AFNI, α=0.05, p<0.05, cluster size > 2630mm3).
Abbreviations: CN, control non-drug users; HD, heroin dependent subjects.

