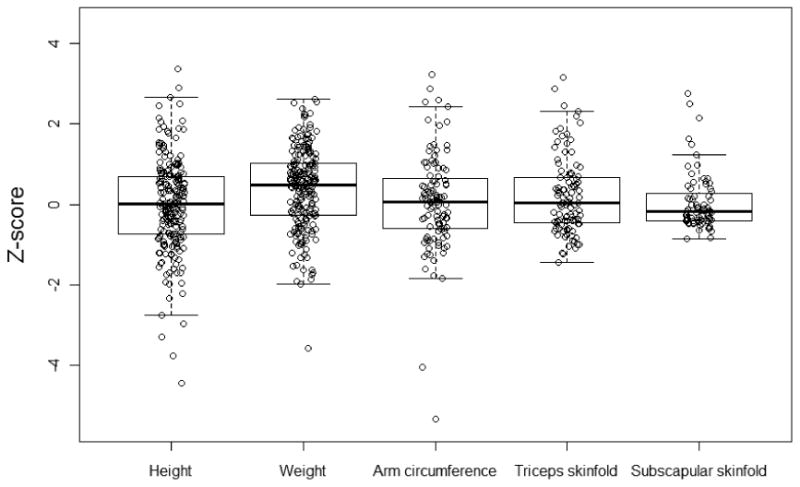
Figure 2.

Boxplots of serum total bilirubin, INR, and platlet count. From top to bottom, the five horizontal lines represent the largest data point, which is not more than 1.5 times the interquartile range from the box, the 3rd quartile, the median, the 1st quartile, and the smallest data point which is no more than 1.5 times the interquartile range from the box, respectively.
