
Figure 1. Overall and Stratum-Specific Associations of Log10 Dialkylphosphate Metabolite levels and Total SRS Score.
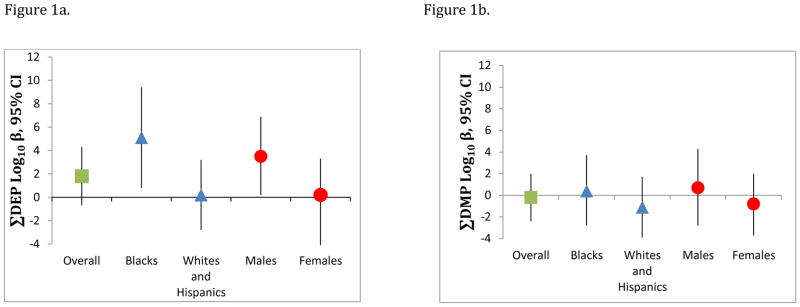
Figure 1a shows the association between increasing log10 ΣDEPs and total SRS t-scores according to race and sex. Stronger adverse associations with SRS score were found for blacks and boys, with no associations among whites/Hispanics and girls (Race p-interaction = 0.06; Sex p-interaction= 0.12). Figure 1b shows null associations between log10 ΣDMPs and SRS total t-scores overall, within strata of Race/ethnicity and sex, and no interaction (Race p-interaction =0.48, Sex-interaction =0.52 ). Models adjusted for log creatinine, mother’s marital status, mother’s education, housing status, child age, race, and sex.