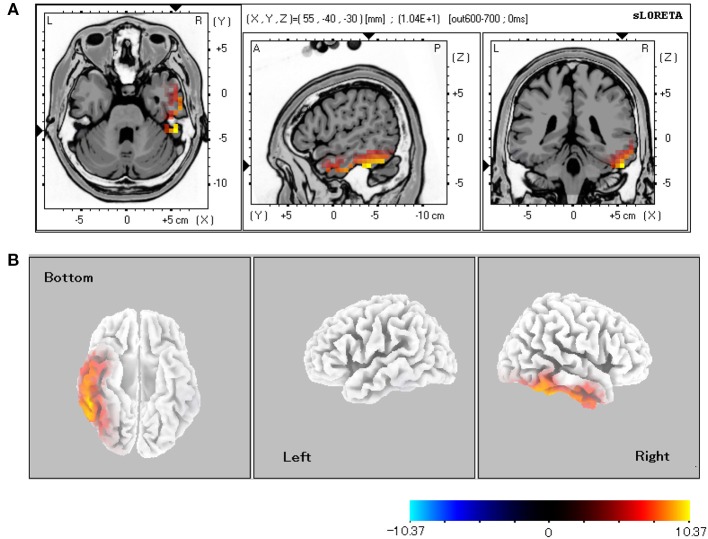
Figure 3.
sLORETA comparison of source localizations between the CS+ and CS− conditions. (A) MRI planes (Colin27 brain) in the axial, sagittal, and coronal views and (B) cortical maps from the bottom, left, and right sides of the average among the 600–700-ms latencies (CS+ vs. CS−). The statistically significant regions acquired from all the subjects were displayed on a standard brain template in (A). The source estimation indicates the significant roles (p < 0.05 for all the subjects) of the right lateral fusiform gyrus.

