
Figure 4.
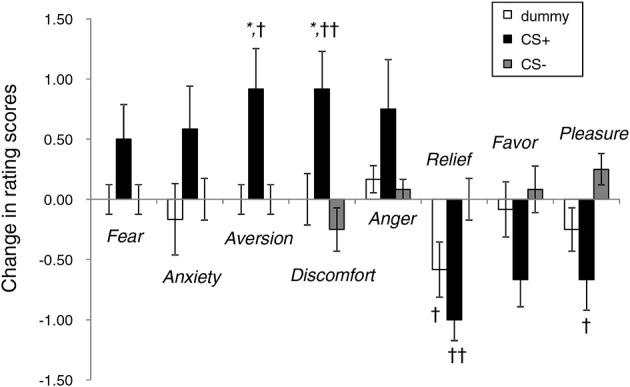
Changes in the rating scores of emotional responses to neutral face stimuli before and after the conditioning experiments. *p < 0.05 vs. a dummy; ††p < 0.01, †p < 0.05 vs. CS−.
Official websites use .gov
A
.gov website belongs to an official
government organization in the United States.
Secure .gov websites use HTTPS
A lock (
) or https:// means you've safely
connected to the .gov website. Share sensitive
information only on official, secure websites.
Changes in the rating scores of emotional responses to neutral face stimuli before and after the conditioning experiments. *p < 0.05 vs. a dummy; ††p < 0.01, †p < 0.05 vs. CS−.