
Figure 1.
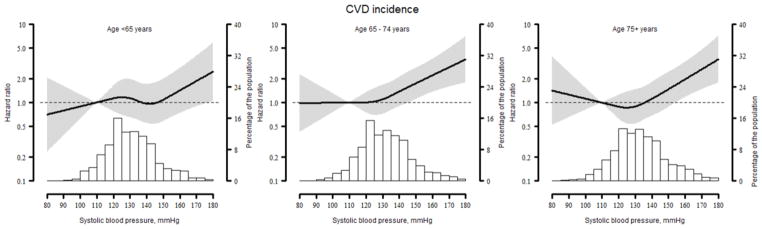
Restricted quadratic splines showing the association between systolic blood pressure and cardiovascular disease among REGARDS participants by age group.
Line represents the hazard ratio with the reference set at a systolic blood pressure of 110 mmHg. Grey area represents the 95% confidence interval. Histograms represent the distribution of systolic blood pressure in the population analyzed. The association is adjusted for age, race, gender, region of residence, income education, dyslipidaemia, diabetes, current smoking, atrial fibrillation and diastolic blood pressure.