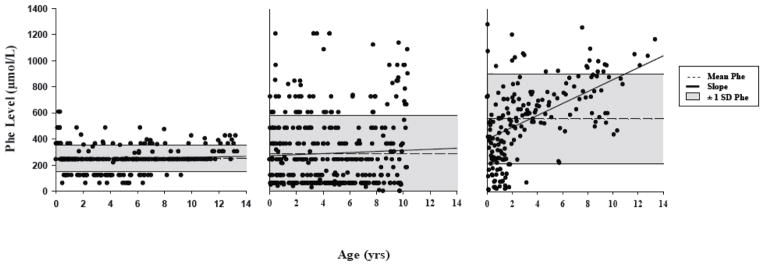
Figure 1.

Profiles of Phe control over the lifetime from 3 children in our sample: (a) low average, flat slope, low variability; (b) low average, flat slope, high variability; (c) high average, steep slope, high variability.

Profiles of Phe control over the lifetime from 3 children in our sample: (a) low average, flat slope, low variability; (b) low average, flat slope, high variability; (c) high average, steep slope, high variability.