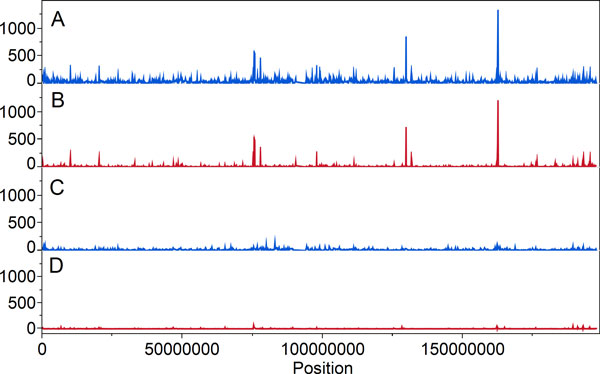
Figure 2.

Distribution of MIEs over the chromosome 3 in 1000 variant bins in the binary variants. A. Peaks of MIEs where variants passed SVM and INDEL5 filters. B. Peaks of MIEs calculated using PLINK. C. Subsequent filtering where variants passed additional SVM filter with threshold >3.5. D. Subsequent filtering where variants passed additional SVM filter with threshold >3.5 and MIE calculation using PLINK.
