Figure 3.
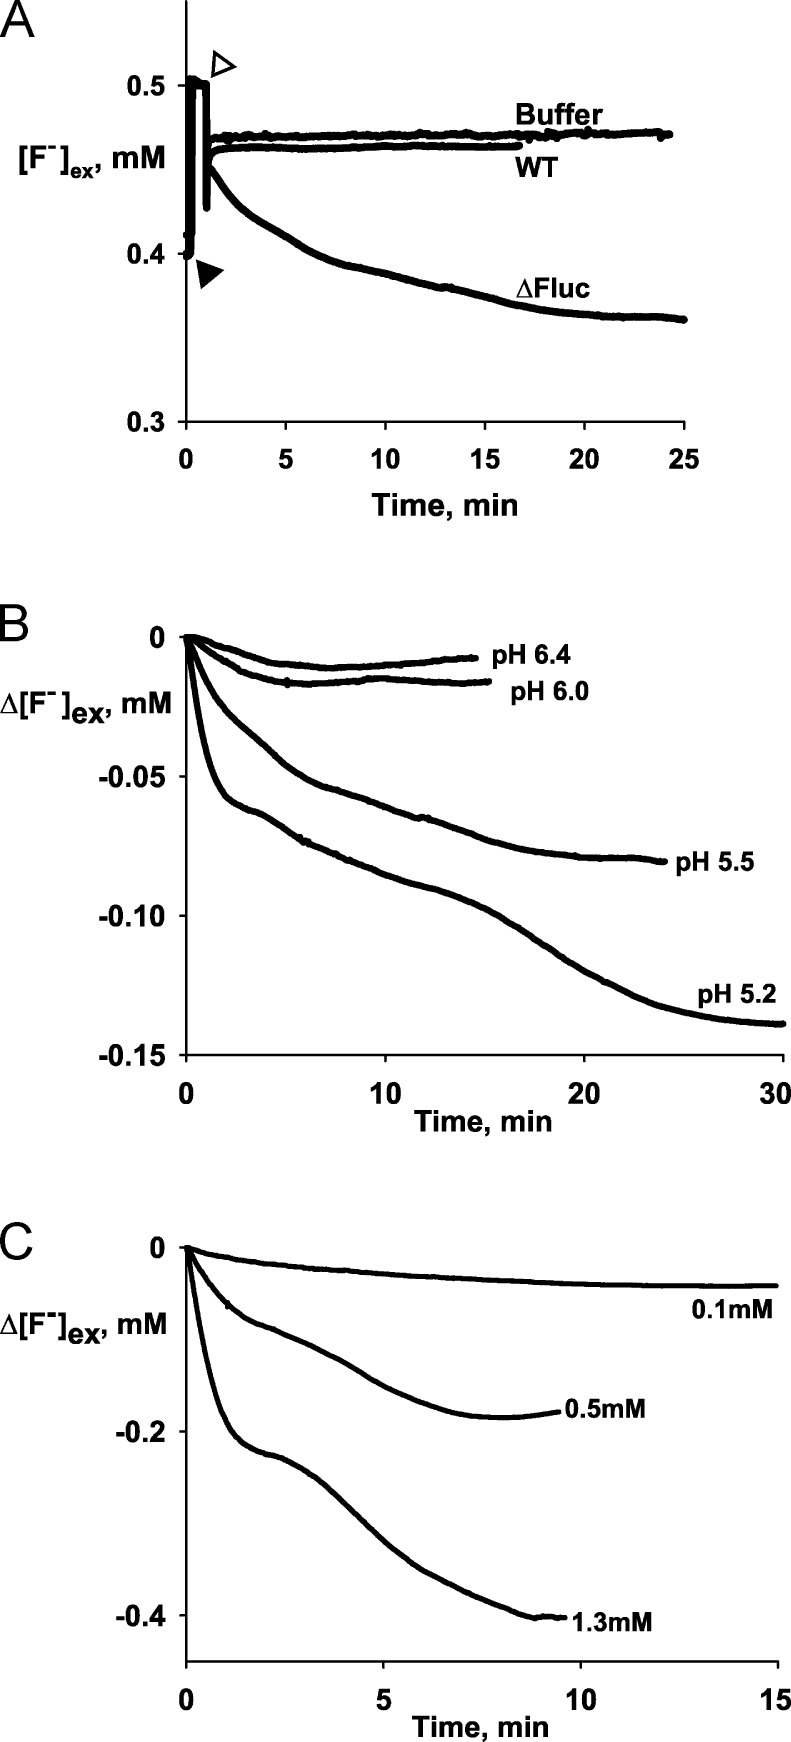
F− uptake by E. coli. (A) Raw data traces of extracellular F− concentration in suspensions of wild-type and ΔFluc E. coli in response to acid exposure or control buffer without cells. Calibration pulse of 0.1 mM NaF (closed triangle) and addition of HCl to drop the pH from 7.5 to 5.5 (open triangle) are indicated. (B) Representative F− electrode traces of F− uptake by ΔFluc E. coli cells in 0.5 mM F− medium, with changing external pH to the indicated values at t = 0. (C) F− uptake at pH 5.3 in the indicated concentrations of external F−.

