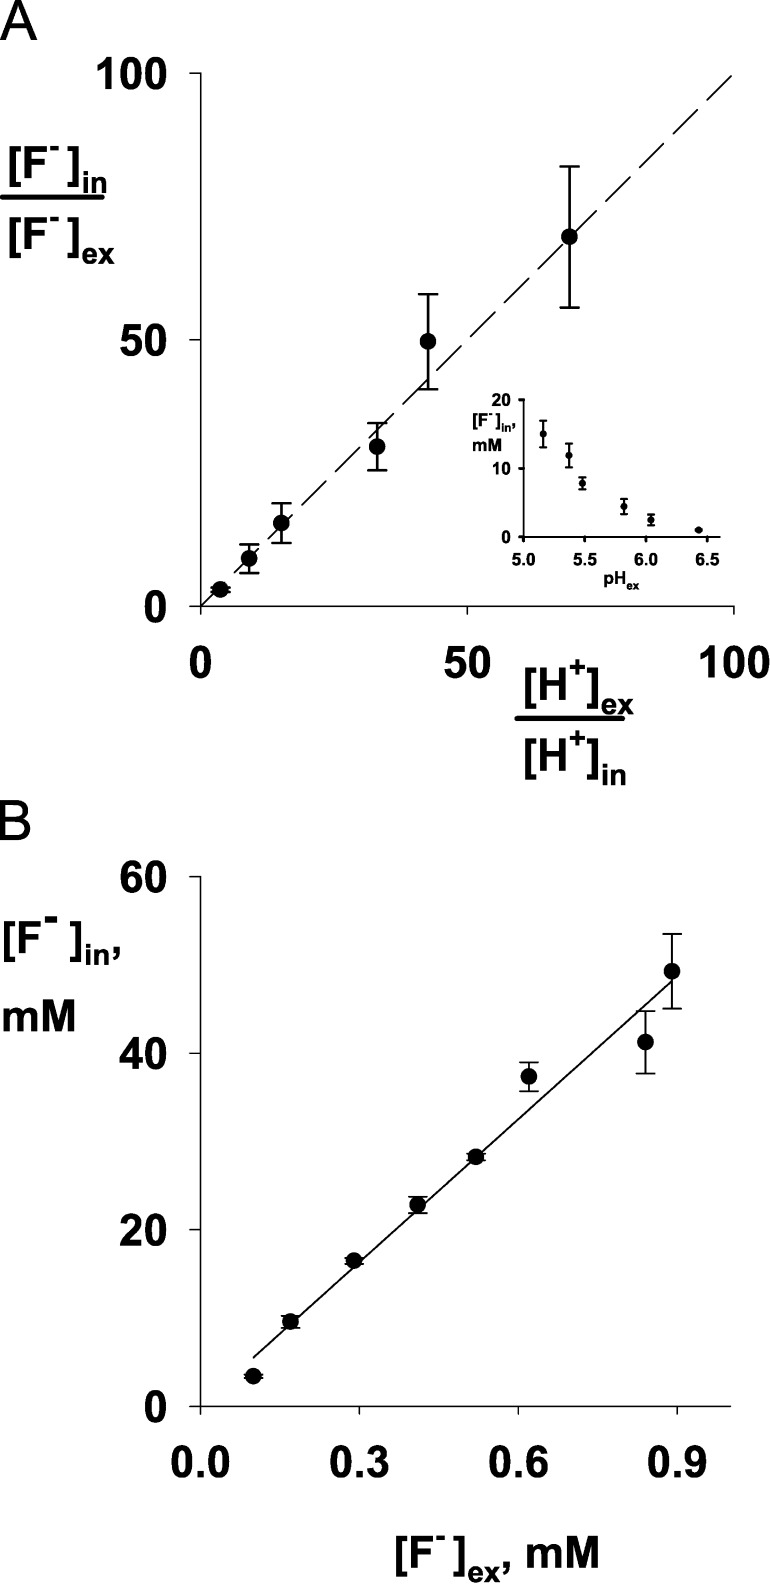
Figure 4.
F− uptake by ΔFluc E. coli cells as a function of pH or F− concentration. (A) Ratio of internal and external [F−] with varying pH. The dashed line has a slope of 1, as predicted by Eq. 1. Inset plots data directly against medium pH. (B) Ratio of internal and external F−. The solid line is a fit to the data with slope of 54, corresponding to a transmembrane pH differential of 1.7 units. F− uptake was determined as in Fig 3. Each point shows mean (±SEM) of three independent measurements. Internal pH was assumed to remain constant at 7.0.

