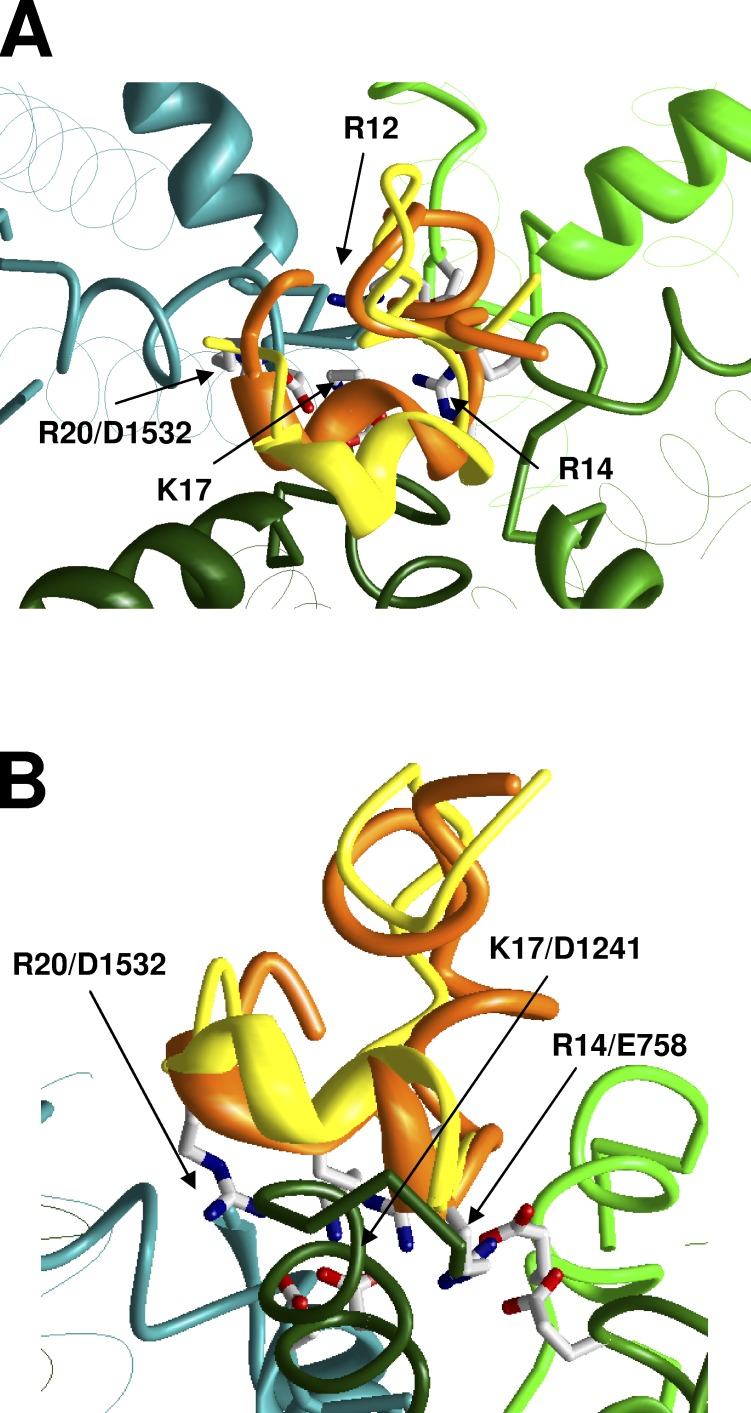
Figure 3.
Predicted complex of PIIIA (orange backbone) with Nav1.4. (A and B) Side and top views. For comparison, GIIIA (yellow backbones) is shown in the same binding mode as in Fig. 2. Superposition of the toxins indicates similarity of their binding models.

