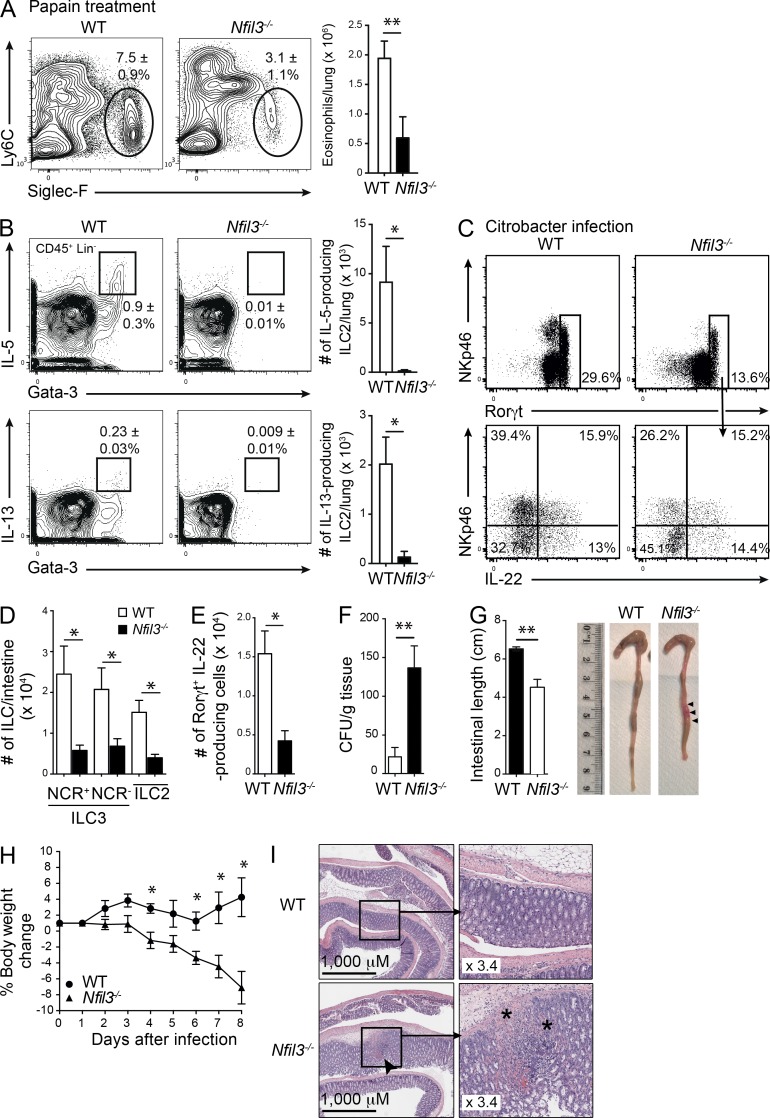
Figure 4.
Nfil3−/− mice fail to mount effective immune responses in the absence of ILC2 and ILC3. (A) Representative flow cytometric profiles of eosinophils recovered in the lungs of Papain-treated WT and Nfil3−/− mice 1 d after the final treatment (left). Profiles are gated on CD45+ total live cells. Total number of eosinophils recovered from lungs showing mean ± SEM (right). (B) Expression of IL-5 and IL-13 among CD45+CD3−CD19− hematopoietic cells stained for intracellular Gata-3 (left). Total number of IL-5– and IL-13–expressing ILC2 in the lung (right). (A and B) Data show the mean ± SEM of data from 1 of 2 independent experiments (n = 4 mice/genotype). (C) IL-22 cytokine production by ILCs isolated from the small intestine of WT and Nfil3−/− mice gated on Lin− (CD3−CD19−) CD45+ cells 8 d after intragastric infection with C. rodentium. Cells were stimulated with IL-23 ex vivo in the presence of Brefeldin A. (D) Enumeration of the number of ILCs found in the intestine 8 d after infection of Nfil3−/− and WT mice with C. rodentium. (E) Enumeration of the number of IL-22–producing ILC3 cells recovered from the small intestine after infection. (F) Bacterial load in spleen, (G) colon length, and (H) weight loss in WT and Nfil3−/− mice after C. rodentium infection. (I) Representative H&E staining of the colon of C. rodentium–infected WT and Nfil3−/− mice on day 8. Bar, 1,000 µm; inset magnification 3.4×. Arrow indicates site of damage; * shows damage and lymphocyte infiltration. (C–I) Data are representative of two independent experiments (n = 3–4 mice/genotype). Error bars show the mean ± SEM. Statistical differences were tested using an unpaired Student’s t test. n.s. not significant. *, P < 0.05; **, P < 0.01.

