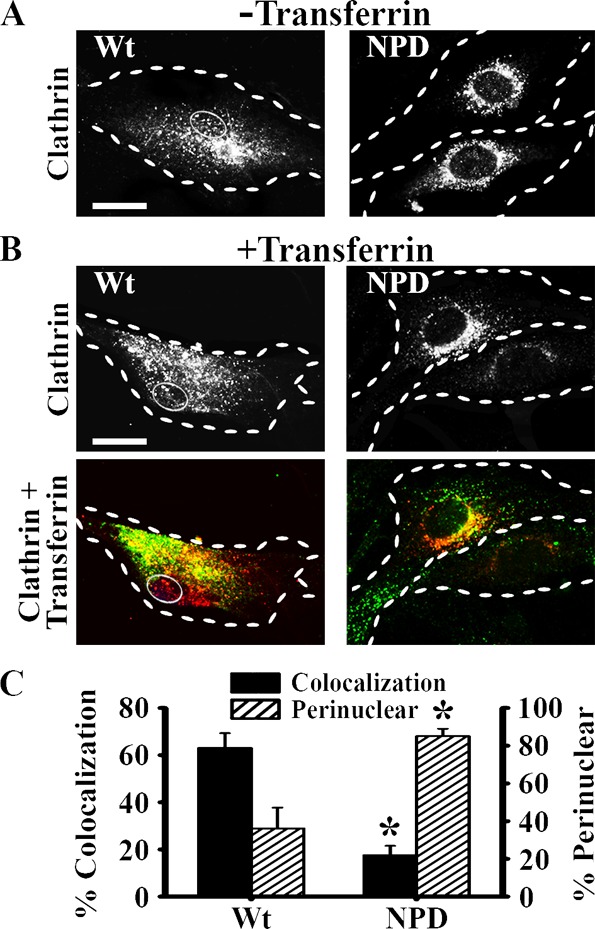
Figure 3.

Colocalization of transferrin with clathrin in NPD fibroblasts. (A) Fluorescence microscopy images of Wt and NPD fibroblasts showing the distribution of clathrin heavy chain in the absence of ligands added in the cell media. (B) Cells were incubated with transferrin for 1 h at 37 °C, washed, fixed, and clathrin heavy chain was immunostained red. Top panels illustrate the distribution of clathrin. Bottom panels show colocalization (yellow) of clathrin (red) and transferrin (green) in the same cells. (A,B) Dashed lines = cell borders. Thin solid line = nuclei in Wt cells. Scale bar =10 μm. (C) Quantification of the percent of bound transferrin that colocalized with clathrin, and the percent of clathrin distributed within ∼3 μm of the cell nucleus (perinuclear). Data are the mean ± SEM. *Comparison with Wt cells (p < 0.05 by Student’s t test).
