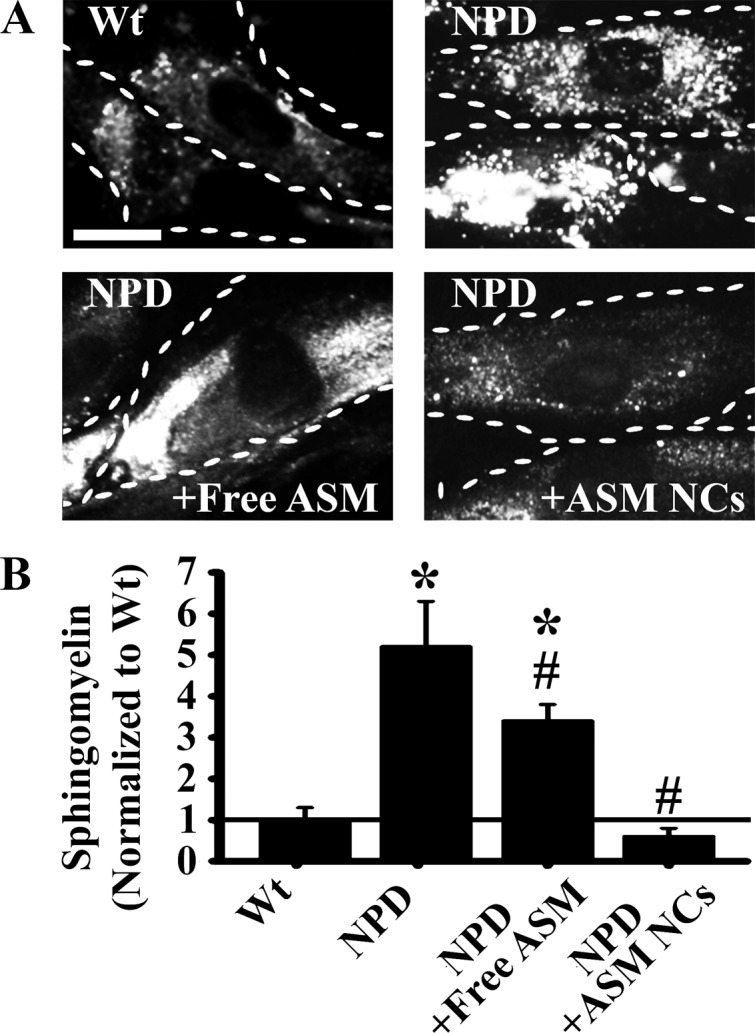
Figure 6.

Reduction of sphingomyelin accumulation in NPD fibroblasts by ASM delivery. TNF-stimulated Wt and NPD fibroblasts were incubated overnight with fluorescent BODIPY-FL-C12-sphingomyelin to permit visualization of lipid accumulation. (A) Fluorescence microscopy images of cells receiving no treatment, free ASM, or anti-ICAM/ASM NCs for 1 h at 37 °C. Cells were washed and fixed 3 h later to permit sphingomyelin degradation. Dashed lines = cell borders. Scale bar = 10 μm. (B) Quantification of sphingomyelin fluorescence, normalized to the Wt level. Data are the mean ± SEM. *Comparison with Wt. #Comparison with untreated NPD control (p < 0.05 by Student’s t test).
