Figure 2.

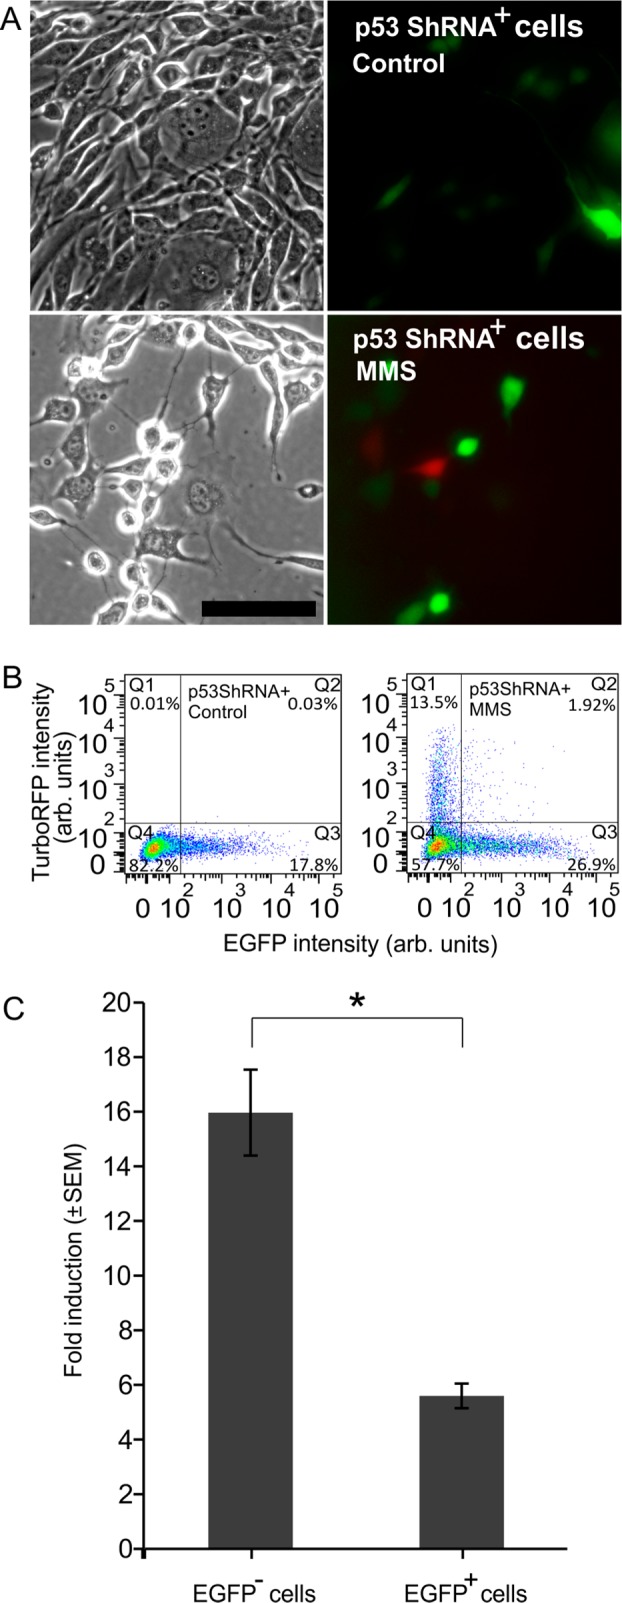
(A) Phase and fluorescence images of p53 shRNA transfected DNA damage biosensor cells expressing EGFP (green) without (controls) and with (MMS) exposure to 1 mM MMS. Scale bar is 100 μm. Cells that express EGFP did not exhibit red fluorescence. (B) FC scatter plots of p53 shRNA transfected biosensors’ TurboRFP signal of controls (left) and exposed to MMS (right). (C) Fold-induction of red fluorescence of p53 shRNA-transfected cells in response to MMS. EGFP– cells are derived from Q1 and Q4 of part B, right scatter plot, and EGFP+ cells are from Q2 and Q3 of part B, right scatter plot.
