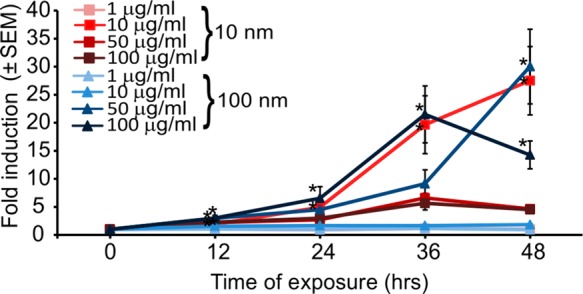
Figure 5.

Dose and time response of DNA-damage reporter cells to Ag-NPs. Exposed cells were analyzed using FC at different time points after exposure and the mean red fluorescence intensity was compared to the mean red fluorescence intensity of the control biosensor cells (n = 3; error bars, standard error of mean).
