
Figure 2.
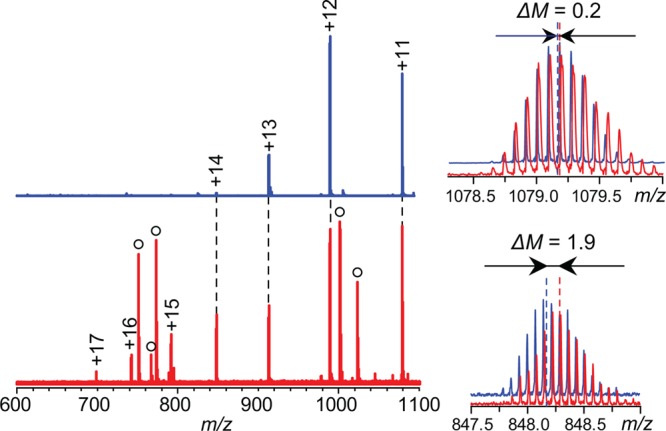
ESI mass spectra of 2 μM β2m in TCEP-free (blue) and 5 mM TCEP-containing (red) quench solutions. Peaks labeled with circles correspond to TCEP and TCEPO clusters. The two side panels show isotopic distributions of protein ions at charge states 11+ and 14+ generated from TCEP-free (blue) and TCEP-containing (red) solutions.