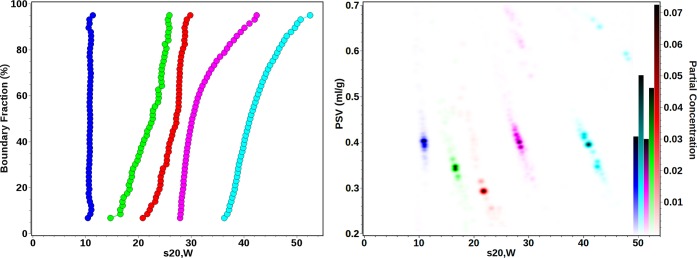
Figure 3.

Combined van Holde–Weischet21 (left) and pseudo-three-dimensional plots (right) of CdSe and PbS QDs demonstrating their partial specific volume (PSV) distributions with respect to their sedimentation speeds (standardized to water at 20 °C) and their partial concentrations, which is given by the color scale in the right y-axis. Blue, CdSe 10.61; green, PbS 12.60; red, PbS 15.00; magenta, CdSe 17.05; cyan, CdSe 20.15, also compare Table 1.
