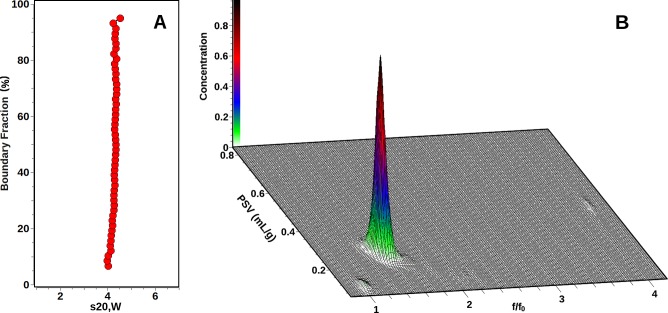
Figure 4.
M4Ag44(p-MBA)30 SV results. (A) integral van Holde – Weischet distribution showing a nearly vertical slope, indicating homogeneity of the sample. (B) Three-dimensional view of the Custom Grid–Monte Carlo analysis with a fixed molar mass constraint reflecting the single species observed in panel A and a variable frictional ratio (x-axis) and variable partial specific volume (y-axis). Two apparent contaminants with insignificant partial concentrations are also found at f/f0 values of approximately one and four. The color gradient reflects the partial concentration of each species.

