Figure 3.

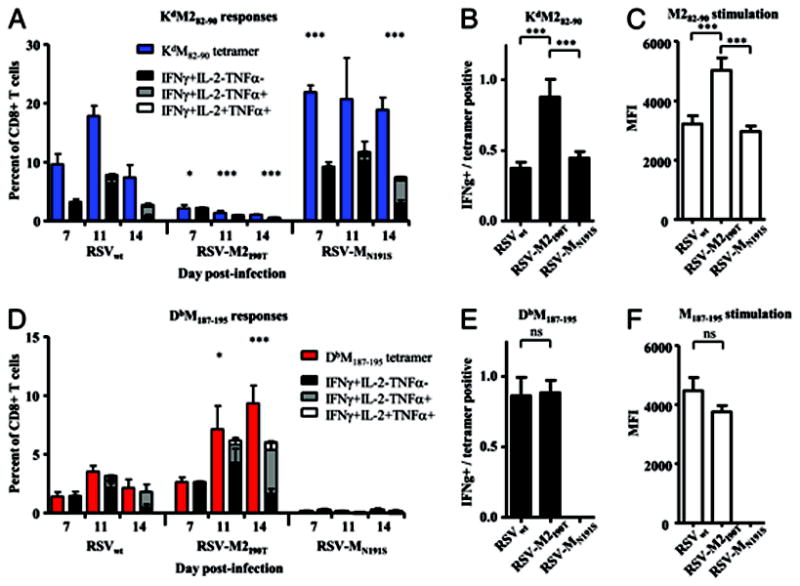
Quantity versus quality of RSVepitope-specific CD8+ T cell responses in mice infected with RSVwt, RSV-M2I90T, or RSV-MN191S. A, Frequency and cytokine production by KdM282–90-specific CD8+ T cells in the lung following infection with RSVwt, RSV-M2I90T, or RSV-MN191S. Parallel samples were stained with tetramer and incubated with M282–90 peptide for 5 h in the presence of the transport inhibitor monensin. B, Fraction of KdM282–90-specific cells capable of producing cytokine following M282–90 peptide stimulation. C, MFI of IFN-γ–positive cells following peptide stimulation with M282–90 following group gating on cells producing IFN-γ. D, Frequency and cytokine production by DbM187–195 epitope-specific CD8+ T cells following infection. E, Fraction of DbM187–195-specific cells capable of producing cytokine following M187–195 peptide stimulation. F, MFI of IFN-γ–positive cells following peptide stimulation with M187–195. *p < 0.05 compared with RSVwt; ***p < 0.001 compared with RSVwt. Data are representative of two experiments with four to five mice/group and error bars represent the SEM. ns, no significance.
