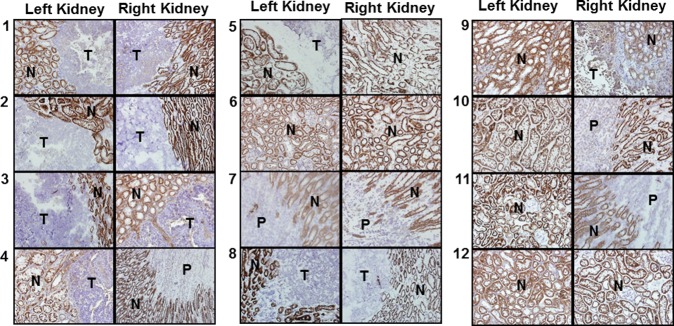
Figure 4.

Color images of immunohistochemical sections of all mouse kidneys stained for APN expression. All images were taken in 40× magnification. Positive regions are as seen dark brown, and negative regions are represented by light brown to blue staining. N: normal. T: tumor. P: pelvis.
