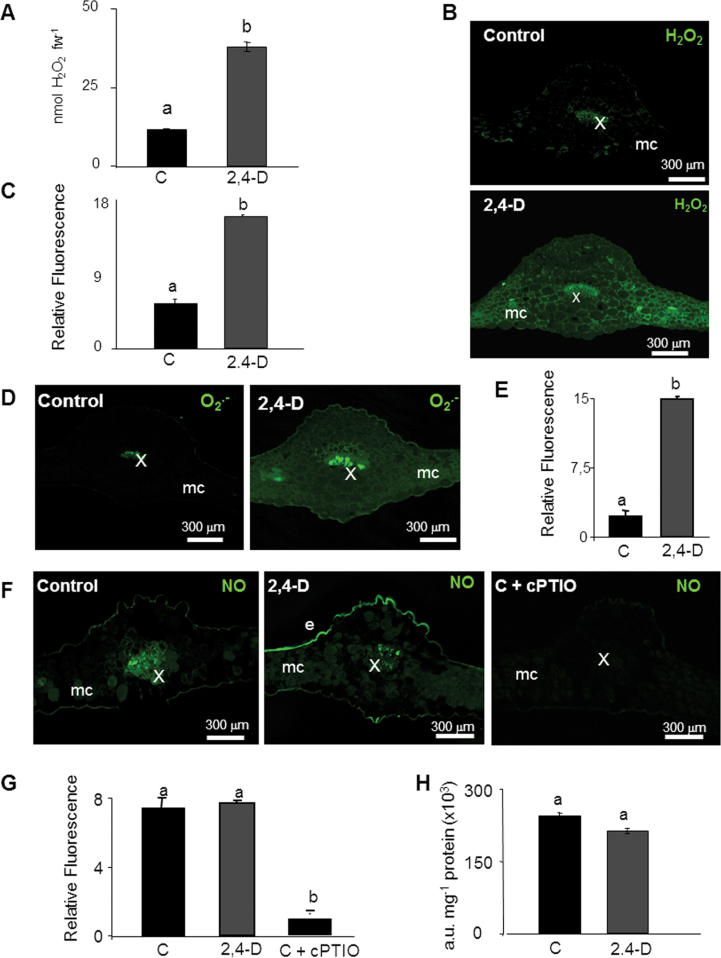
Fig. 2.
Imaging and quantification of H2O2, O2·–, and NO production induced by the treatment with 2,4-D in Arabidopsis thaliana leaves. (A) H2O2 content was analysed in acid extracts from Arabidopsis leaves by fluorimetry. Values are means ±SE of four different experiments with three independent extracts each. (B) Imaging of H2O2 accumulation in cross-sections of Arabidopsis leaves by CLSM using DCF-DA (Ex/Em: 485/530nm). DCF-DA fluorescence was quantified in arbitrary units (C). (D, E) Imaging and quantification of O2·– production using DHE (Ex/Em: 450–490/520nm. (F, G) Imaging and quantification of NO production using DAF-2DA (Ex/Em: 495/515nm). cPTIO was used as an NO scavenger. (H) NO content was quantified in arbitrary units (a.u.) in leaf extracts from Arabidopsis leaves by fluorimetry. Images are maximal projections from several optical sections and are representative of at least 15 leaf sections from four different experiments. Different letters indicate a significant difference at P<0.05 as determined by Duncan′s multiple-range test. e, epidermis; mc, mesophyll cells; st, stomata; x, xylem.

