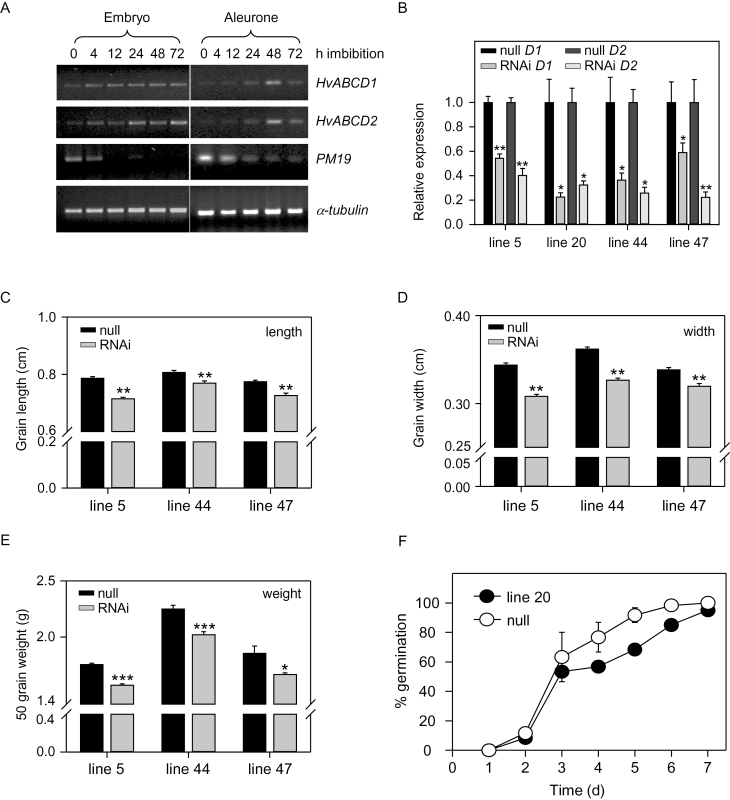
Fig. 1.
Seed phenotypes of HvABCDi lines. (A) RT–PCR analysis of HvABCD1 and HvABCD2 expression in embryo and endosperm during germination. (B) Quantitation of HvABCD1 and HvABCD2 transcripts in RNAi lines, using Q-PCR. Transcript abundance in each RNAi line is expressed relative to abundance in the respective null segregant. Values are means ±SE (n=3); *P<0.05, **P<0.01. (C–E) Grain length, width, and weight in RNAi lines, relative to the respective null segregants. Values are means ±SE (n=5, 50 seeds per replicate); *P<0.05, **P<0.01, ***P<0.001. (D) Germination of RNAi line 20 and the corresponding null segregant over 7 d. Values are means ±SE (n=3).

