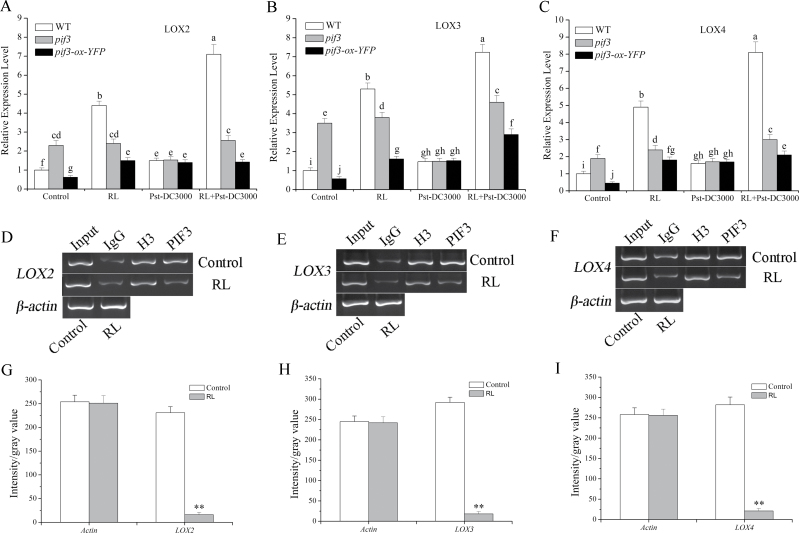
Fig. 4.
PIF3 inhibits LOX transcript expression by binding to its gene sequence. (A–C) PIF3 inhibited LOX2, LOX3, and LOX4 transcript levels. Expression levels were detected 4h after different treatments as indicated above using quantitative RT-PCR. Arabidopsis ACTIN2 was used as an internal control. Expression levels for each treatment were normalized to a RL-treated (0h) plant. (D–F) The binding of PIF3 and LOX gene sequence in normal light (control) or RL-treated (120 μmol photons m–2 s–1 for 4h) samples of the pif3-ox-YFP plant determined by ChIP. The co-immunoprecipitated DNA was detected by agarose gel electrophoresis. Input indicated samples before immunoprecipitation; IgG, H3, and PIF3 indicate samples immunoprecipitated with IgG antibody, H3 antibody and YFP antibody, respectively. (G–I) Quantitative analysis of the LOX2 (D), LOX3 (E) and LOX4 (F) genes of PIF3 samples are shown in (G), (H), and (I), respectively, with Image J software. Three gel photographs were taken for quantitative analysis, and values represent means±SD. Asterisks indicate significant differences between the control and RL treatment (Student’s paired t-test: *P<0.05, **P <0.01).

