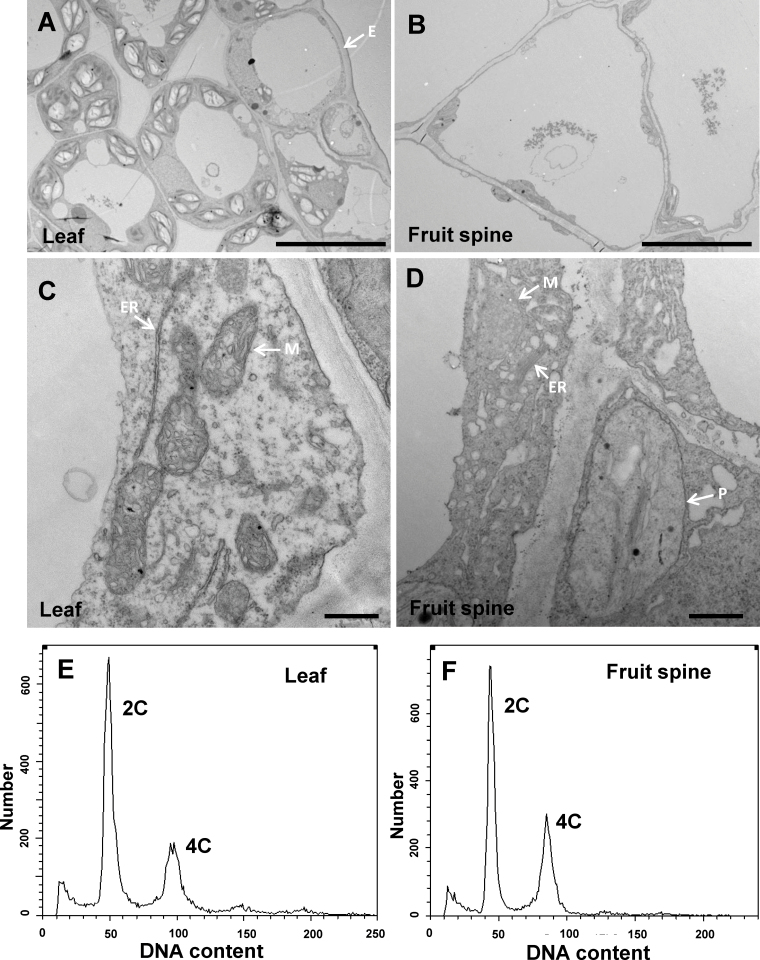
Fig. 2.
Internal structure of cucumber trichome cells. (A–D) Transmission electron micrographs of the abaxial leaf cells (A, C) or the base cells of fruit spine (B, D) from WT cucumber. Bars, 10 µm (A, B); 500nm (C, D). (E, F) Flow cytometric analysis of the DNA content of nuclei in the tbh mutant leaf tissue (E) and WT fruit spines (F). The histograms show the DNA content of each nucleus. E, epidermal cell; P, plastid; ER, endoplasmic reticulum; M, mitochondria.

