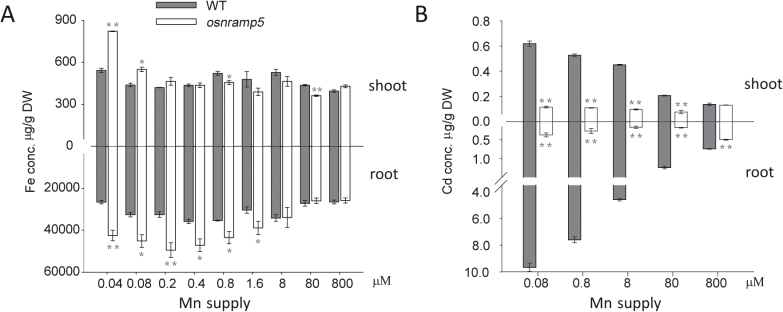
Fig. 4.
The concentrations of Fe and Cd at different Mn supplies. The concentrations of Fe (A) and Cd (B) of wild-type and osnramp5 mutant plants were analysed at different Mn supplies. Data are means±SD of three biological replicates, and five plants were mixed in one replication for metal determination. One and two asterisks indicate values are significantly different from the WT at the levels of P<0.05 and P<0.01, respectively (t-test).

