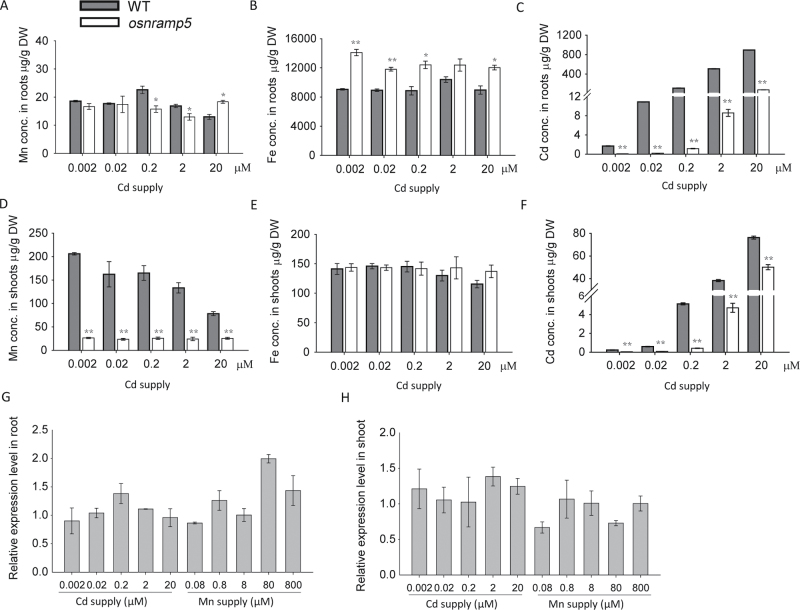
Fig. 5.
The metal concentrations and expression levels at different Cd supplies. Plants were grown under normal condition for two weeks and then transferred to different Cd supplies for additional two weeks. Mn, Fe, and Cd concentrations were analysed in roots (A–C) or shoots (D–F) of rice plants at different Cd supplies. Expression levels of OsNRAMP5 of roots and shoots at different Mn or Cd supplies were analysed in (G) and (H) respectively. Data are means±SD of three biological replicates, and five plants were mixed in one replication for metal determination. One and two asterisks indicate values are significantly different from the WT at the levels of P<0.05 and P<0.01, respectively (t-test).

