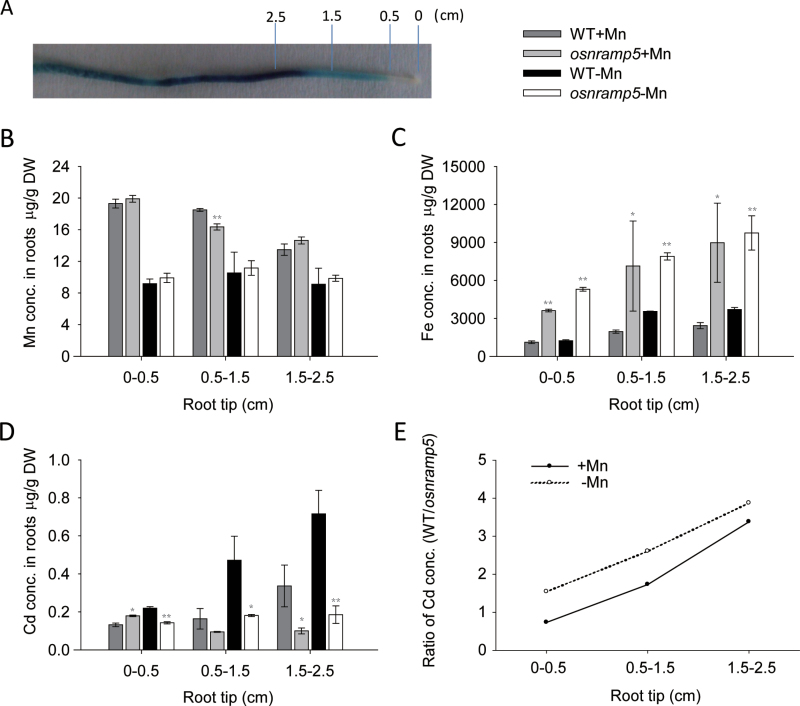
Fig. 8.
The distribution of metals in different root zones. (A) Root expression pattern of OsNRAMP5. The expression pattern was detected in plants transformed with the construct OsNRAMP5-promoter:GUS by histochemical straining of GUS activity. 0, 0.5, 1.5, 2.5 represent the distance from root tip by centimetre. (B–D) Mn, Fe, and Cd concentrations in different root zones. (E) The ratio of Cd concentrations between wild type and knock-out line of OsNRAMP5. Data are means±SD of three biological replicates, each sample in one replication was harvested from 30 plants. (This figure is available in colour at JXB online.)

