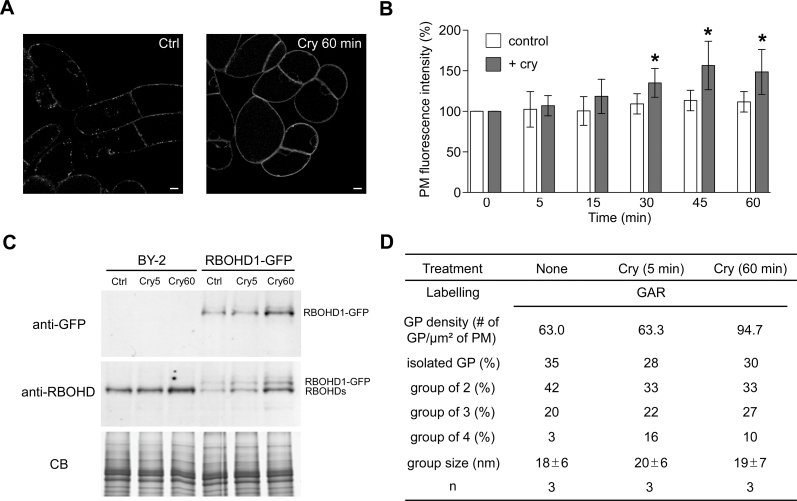
Fig. 4.
PM abundance of RBOHDs increases upon elicitation by cryptogein. (A) RBOHD1-GFP-expressing cell before (Ctrl) and after 60min incubation with cryptogein (Cry 60min). Scale bars = 10 µm. (B) Quantification of the PM fluorescence in RBOHD1-GFP cells. Values are means ± SD of 5–16 independent experiments. An asterisk indicates a difference of statistical significance between non-elicited and elicited cells for each time point, Mann-Whitney test (P < 0.05). (C) Western blot analysis of PM fractions from BY-2 and RBOHD1-GFP cells with anti-RBOHD and anti-GFP antibodies. Cells were untreated (Ctrl) or cryptogein-treated for 5min (Cry5) or 60min (Cry60). CB: Coomassie blue staining as a loading control. (D) RBOHD distribution on PM vesicles from elicited BY-2 cells. Values for non-elicited cells are the same as the ones reported in Fig. 2B. Abbreviation: n, number of experiments.

