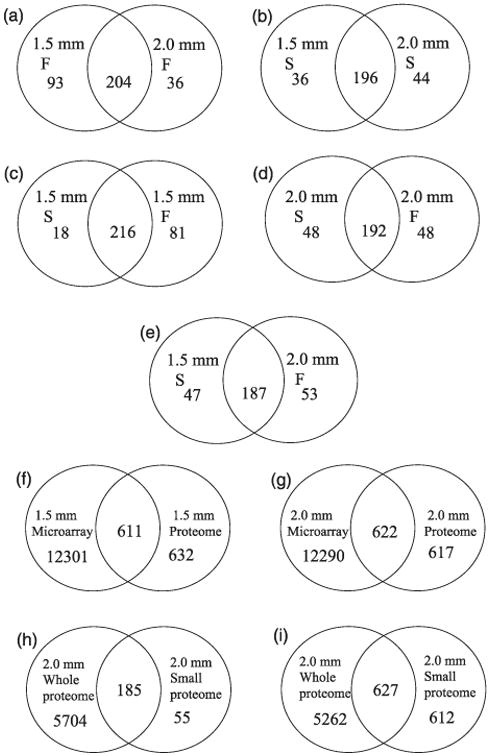
Figure 2.

Venn diagrams of proteome content and overlap in various comparisons. (a) Comparison of fertile 1.5- and 2.0-mm stages; (b) Comparison of sterile 1.5- and 2.0-mm stages; (c) Comparison of sterile and fertile anthers at the 1.5-mm stage; (d) Comparison of sterile and fertile anthers at the 2.0-mm stage; (e) Comparison of 1.5-mm sterile anthers with 2.0-mm fertile anthers protein profile to test for precocious protein accumulation in ms8 anthers; (f) Comparison of transcriptome (transcripts with unique protein ID) and proteome data sets at the 1.5-mm stage; (g) Comparison of transcriptome (transcripts with unique protein ID) and proteome data sets at the 2.0-mm stage; (h) and (i) Comparison of a deep-sequenced whole anther proteome (unpublished data from Zhouxin Shen and S. Briggs utilizing staged W23 anther samples dissected at Stanford) and the reported proteome focused on low molecular weight proteins; (h) comparison of the whole anther proteome with 240 highly secure identified proteins in 2-mm fertile anthers addressed here; (i) comparison of whole anther proteome with 1239 proteins with at least one peptide hit identified in 2-mm fertile anthers in our study.
