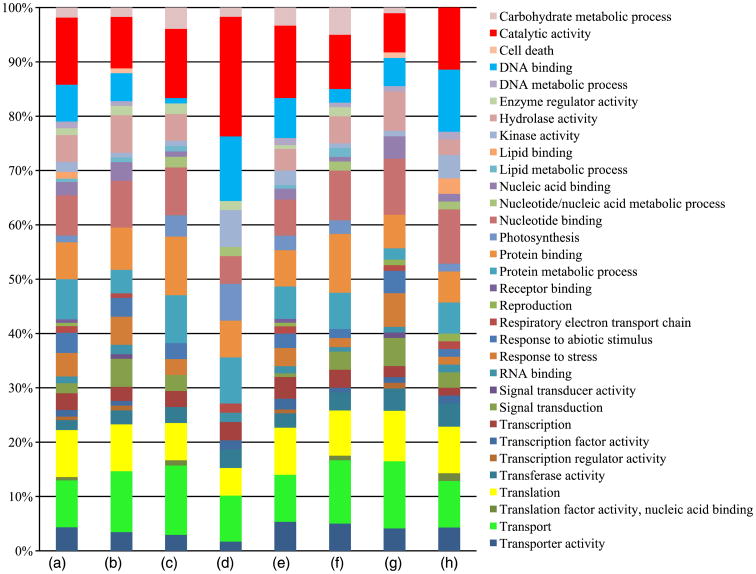
Figure 3.
Gene ontology annotation. Percentage of each gene ontology category of proteins expressed in various comparisons. (a–d): stage-specific proteins; (a) compared with 2.0-mm fertile anthers, specifically expressed proteins in 1.5-mm fertile anthers; (b) compared with 2.0-mm sterile anthers, specifically expressed proteins in 1.5-mm sterile anthers; (c) compared with 1.5-mm fertile anthers, specifically expressed proteins in 2.0-mm fertile anthers; and (d) compared with 1.5-mm sterile anthers, specifically expressed proteins in 2.0-mm sterile anthers; (e–h): fertile or sterile specific proteins; (e) compared with 1.5-mm sterile anthers, specifically expressed proteins in 1.5-mm fertile anthers; (f) compared with 2-mm sterile anthers, specifically expressed proteins in 2.0-mm fertile anthers; (g) compared with 1.5-mm fertile anthers, specifically expressed proteins in 1.5-mm sterile anthers; and (h) compared with 2.0-mm fertile anthers, specifically expressed proteins in 2.0-mm sterile anthers. Categories are in alphabetical order, starting from the top of the list.

