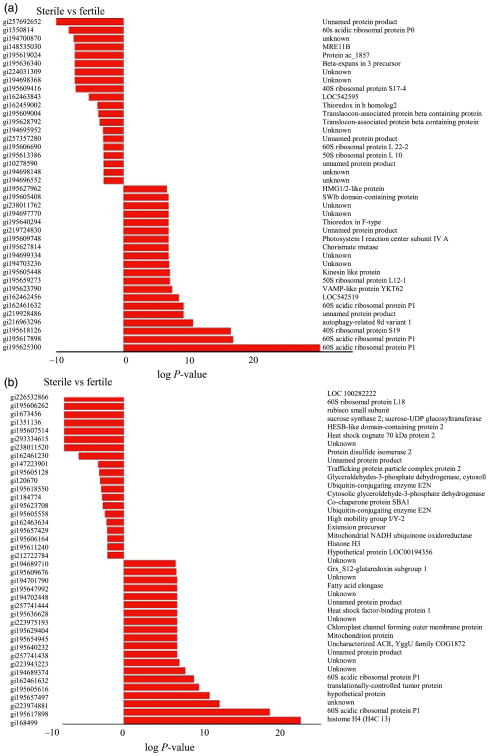
Figure 4.
Differentially expressed protein between ms8 and fertile at the 1.5 and 2.0-mm stages. (a) 1.5 mm differentially expressed proteins; (b) 2.0 mm differentially expressed proteins. The statistical significance was ranked by a Fisher's exact score (P-value). The protein lists were produced from spectral count data of proteins that were identified in both sterile and wild type fractions. All data were manually validated to ensure proteins corresponding to low spectral count (<3) were true positives. The data plotted represent the log of P-value in which a negative value indicates a lower quantitative response in the sterile form and a positive value a higher quantitative response in the sterile form.

