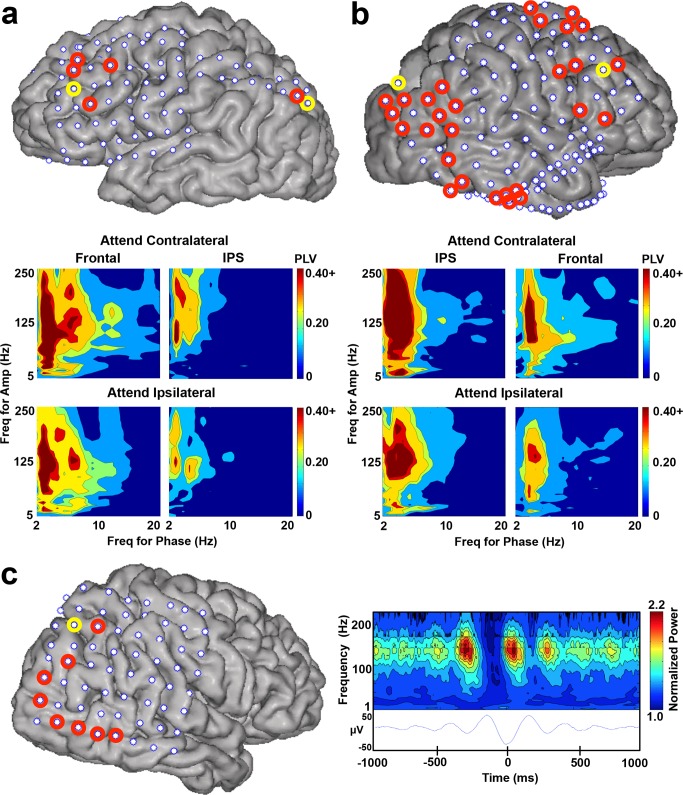
Figure 3. Delta/theta phase-HG amplitude coupling during attentional allocation.
Examples of electrodes with significant delta/theta phase-HG amplitude coupling during attentional allocation. (a,b) Comodulograms for two example electrodes (circled in yellow on each subject's cortical reconstruction), one over lateral frontal cortex and one surrounding the IPS, are shown underneath the respective brain areas of two subjects, S3 (a) and S5 (b). Each comodulogram illustrates PAC strength (measured with PLV) across a range of frequencies (x-axis = frequency for phase signal, y-axis = frequency for amplitude signal). Contour lines represent p-values (outer to inner: p = 0.50, 0.10, 0.05, 0.01, 0.005). Separate comodulograms were calculated for the contralateral and ipsilateral attention conditions. Additional electrodes with significant delta/theta-HG PAC in these two subjects are circled in red. See Figure 6 for the significant electrodes in the remaining subjects. (c) A trough-locked spectrogram from an example electrode over PPC (circled in yellow on the cortical reconstruction of S4). Right, bottom: the trough-locked ERP of the filtered delta/theta signal (2–5 Hz). Right, top: normalized power across a range of frequencies for the corresponding time points of the trough-locked delta/theta signal (below). Additional electrodes with significant delta/theta-HG PAC in S4 are circled in red.

