
Figure 4. PAC-behavioral correlations.
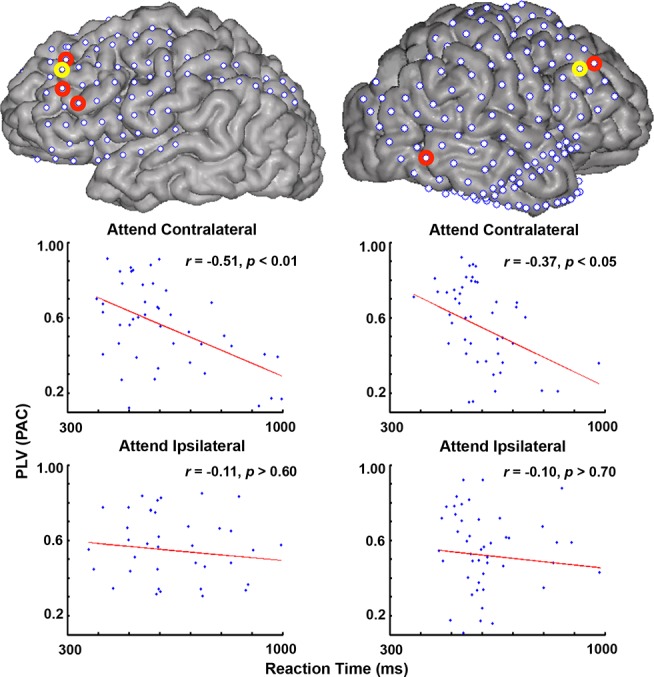
Correlations between the strength of delta/theta-HG PAC (measured with PLV) and reaction times (RTs) during SNT performance. Examples of two different electrodes (circled in yellow on each cortical reconstruction) are shown for two different subjects (S3, left panel and S5, right panel) during attention to either the contralateral (top) or ipsilateral (bottom) visual fields. The red circles on each cortical reconstruction indicate all other electrodes in these two subjects that showed significant PAC-RT correlations across trials. The red line on each scatter plot indicates the regression line through each data set.