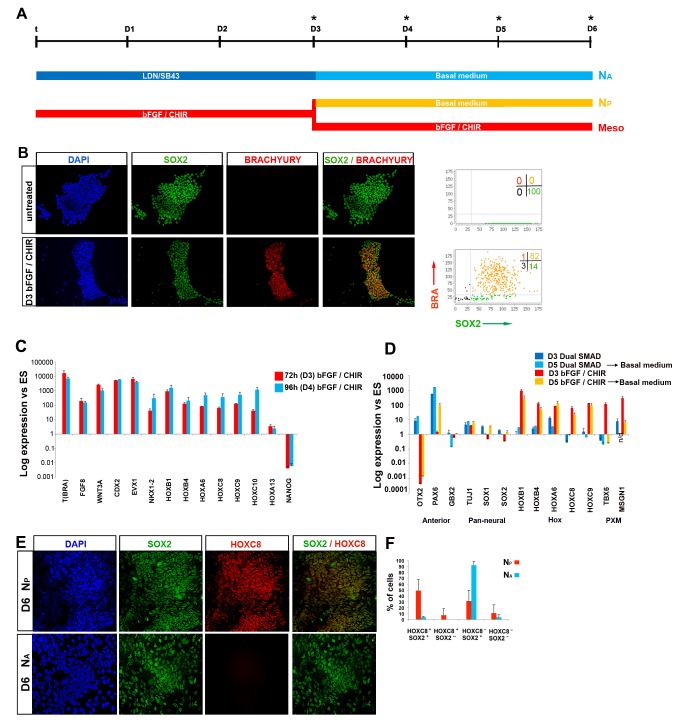
Figure 5. Generation and characterisation of hNMPs.
(A) Scheme describing the culture conditions employed for neural differentiation of hES cells treated for 72 h either with FGF/CHIR or subjected to dual SMAD inhibition (LDN, LDN193189; SB43, SB431542). (B) BRACHYURY/SOX2 immunocytochemistry in undifferentiated and FGF/CHIR-treated (48 h) hES cells. Corresponding graphs depict image analysis of BRACHYURY and SOX2 expression in the indicated culture conditions. Numbers: percentages of cells in each quadrant. (C) qPCR analysis for indicated markers in hES cells treated with FGF/CHIR for 72 h (D3) or 96 h (D4). Error bars = s.d. (n = 2). Results are represented as log10 ratio of expression versus untreated hES cells. (D) qPCR analysis for indicated differentiation markers in hES cells differentiated in N2B27 following either an NM progenitor induction- (NP) or a dual SMAD inhibition-intermediate step (NA). Error bars = s.d. (n = 2). Anterior, anterior neural markers; PXM, paraxial mesoderm; n/d, not determined. (E) Immunocytochemistry for SOX2/HOXC8 in NA and NP culture conditions indicated in the scheme (A). (F) Quantitation of the coexpression of Hoxc8 with Sox2 in NA and NP conditions. All data used to generate the plots can be found in Data S5.

