
Figure 2. Mice with altered CD103+DC development have changes in hepatic neutrophil.
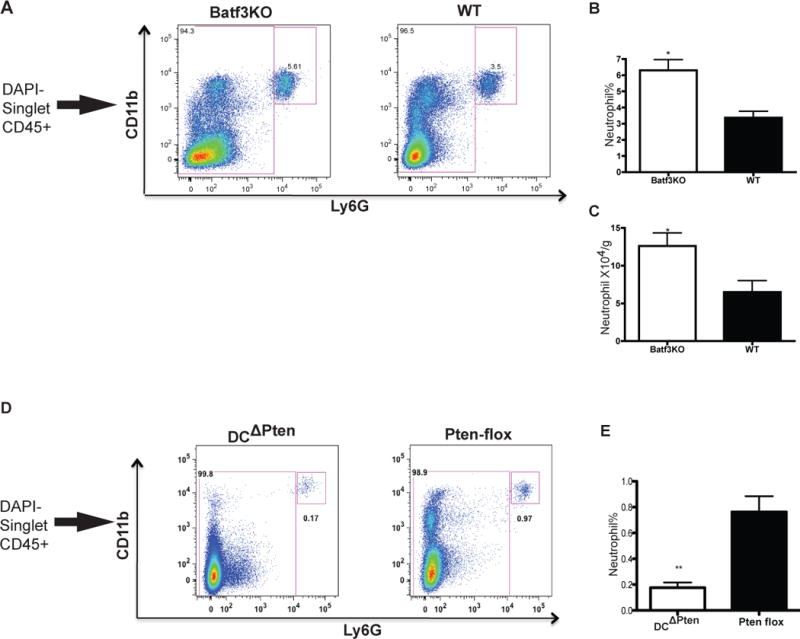
Batf3KO mice have increased neutrophil number in the liver as indicated by FACS (A) and graphed as percentage (B) and absolute number (C). DCΔPTEN mice have decreased neutrophil in the liver as indicated by FACS (D) and graphed as percentage (E) Results are expressed as mean value +/− standard deviation (n=3–5 mice). The experiments were repeated twice with similar results.