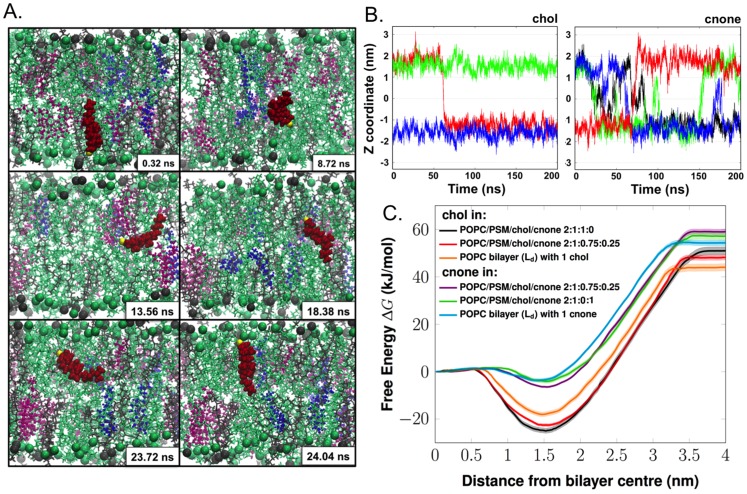
Figure 2. Transbilayer mobility of cholestenone and cholesterol.
A) Snapshots showing the spontaneous flip-flop motion of a cholestenone molecule during MD simulation in the raft-like system POPC/PSM/cholesterol/cholestenone 2∶1∶0.75∶0.25. POPC and PSM are shown as green and grey lines, respectively, with head-group phosphorus atoms as spheres. Cholesterol (chol) and cholestenone (cnone) are shown as magenta and blue ball-and-stick representation, respectively. The particular cholestenone undergoing flip-flop is highlighted as red van der Waals spheres and its 3-keto oxygen atom is shown in yellow. B) Time scale and frequency of flip-flops by cholesterol and cholestenone. Time evolution of the Z-coordinate of the head group oxygen atom of cholesterol (i) and cholestenone (ii) along the bilayer normal in the system POPC/PSM/chol/cholestenone 2∶1∶0.8∶0.2. The Y-axis zero indicates the center of the bilayer. Different colors show different cholesterol or cholestenone molecules. The figures highlight how different the flip-flop rates of cholesterol and cholestenone are: while cholesterol undergoes only a single quick flip-flop event, cholestenone undergoes a large number of flip-flops during the same period. Yet the concentration of cholesterol was four times higher than that of cholestenone. C) The potential of mean forces (kJ/mol) of cholesterol and cholestenone in a variety of lipid bilayer models (shown by dark lines), either in the liquid-disordered (Ld) or liquid-ordered (Lo) phase. The transparent area following each PMF curve represents the corresponding statistical errors.

