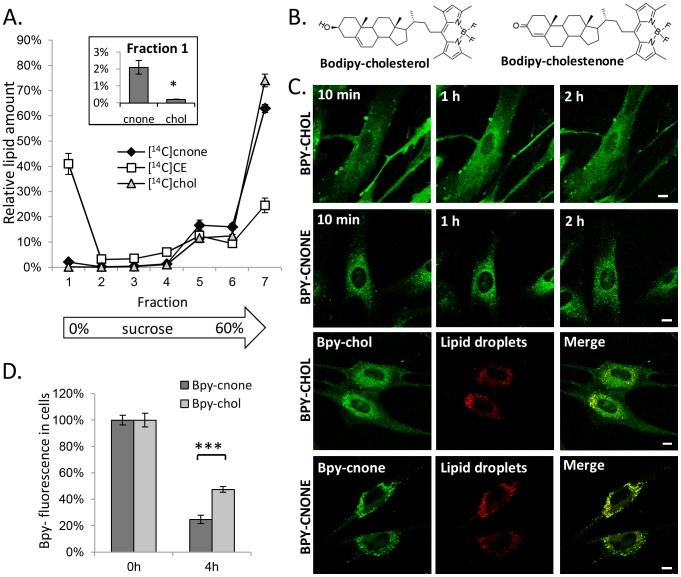
Figure 4. Intracellular trafficking of cholesterol and cholestenone.
A) RAW 264.7 macrophages prelabeled with [14C]cholesterol for 18 h were treated with 10 U/ml coase for 2 h. The post-nuclear supernatant was subjected to sucrose gradient fractionation. A total of 7 fractions was collected and analysed for radiolabeled [14C]cholesterol, -cholestenone, and -cholesteryl ester content. Inset: Percentage of [14C]cholesterol and -cholestenone in the lowest density fraction 1; n = 4. *P<0.05. B) Structures of Bpy-cholesterol (Bpy-chol) and Bpy-cholestenone (Bpy-cnone). C) HDFs were pulse labeled with the indicated Bpy-lipids for 8 min, and the cells were imaged by confocal microscopy during 2 h of chase. To visualize LDs, cells were pulse labeled for 1 h with Bpy568-C12 (5 µM) and Bpy-lipid (1 µM), and imaged after a 1 h chase. Scale bars 10 µm. D) HDFs were pulse labeled with Bpy-lipids and analysed for Bpy fluorescence intensity immediately after the pulse and after 4 h of chase in DMEM, 10% FBS; n = 8; ***P<0.0005.

