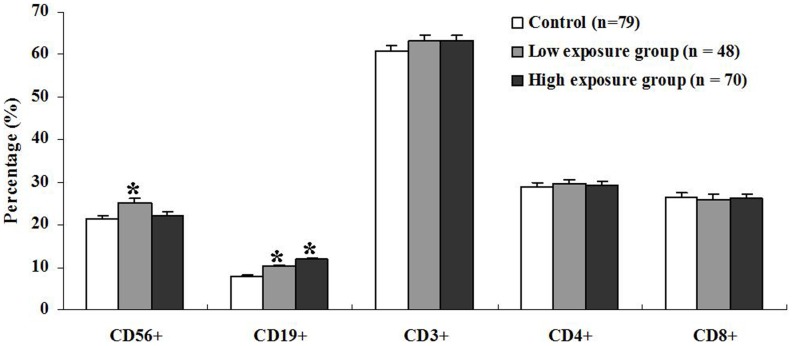
Figure 2. The distribution of major lymphocyte subsets in FA-exposed workers (n = 48 in the low exposure group and n = 70 in the high exposure group) and the control (n = 79).
Percentage of different lymphocytes was presented in the three groups. Aliquots of EDTA whole blood were stained with fluorescence labeled antibodies to the CD3+, CD4+, CD8+, CD19+ and/or CD56+ lymphocytes. Values represent mean±SE; * p<0.05 comparing with control.

