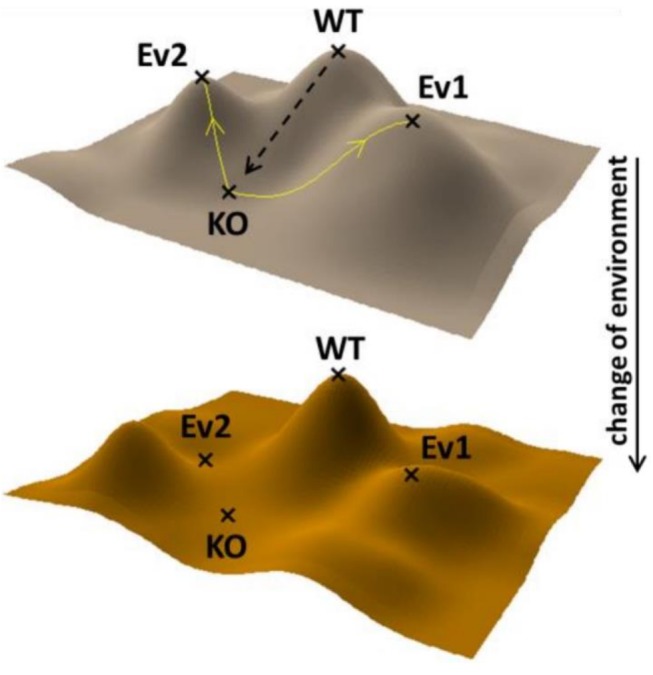
Figure 1. Compensatory evolution on the adaptive landscape.

Schematic representation of the impact of compensatory evolution on the fitness landscape. The x and y axes on the landscape locate the network of neighboring genotypic states, while the z axis defines fitness in a single environment. Gene loss leads to a fitness valley (from WT to KO), while compensatory evolution can drive the population to different adaptive peaks (Ev1 versus Ev2). The upper fitness landscape shows the environment where compensatory evolution took place. The dashed arrow represents the original gene deletion event. Yellow lines represent different evolutionary routes. WT, wild type; KO, ancestor strain with a gene deletion.
